
2017 was a good year for investors. The year was characterized by an accelerating economy and strong gains for stock markets globally. With such a surprisingly good year, questions naturally arise. Can the rally continue? Is there more room to run? Where do we go from here?
A bull with wings
As I was driving one day, I heard a commercial on the radio for the energy drink Red Bull, with its familiar tag line, “Red Bull gives you wings.” It made me think: this is no ordinary bull market. It never seems to go down. It’s like a bull market with wings! This got me thinking further; is there an example in history of a mythological bull with wings? Sure enough, there is: the ancient winged bull, the lamassu. The lamassu is a mythical beast from the Mesopotamian religion, often depicted with a human head, the body of a bull, and the wings of an eagle.
Massive stone statues of the lamassu, dating from the eighth century B.C., guarded the gates of the ancient city of Nineveh (now the city of Mosul in Iraq), where they stood for 3,000 years until, sadly, they were destroyed by the Islamic State. This has to be one of the great cultural tragedies of our time, up there with the Taliban’s destruction of the monumental stone Buddha statues of Bamiyan in Afghanistan. Fortunately, a handful of lamassu statues still exist in museums around the world, including the British Museum and the Met.

I have dubbed the stock market in 2017, with its seemingly never-ending upward trajectory, not an ordinary bull but a winged bull – “the flight of the lamassu.” The market continually defied the skeptics, flying higher and higher throughout the year. At the beginning of the year, many market strategists were predicting a sideways market. Major brokerage firms, such as Goldman Sachs and Credit Suisse, forecasted returns in the low single digits. And yet, as it turned out, the Dow Jones Industrial Average posted a total return of 28% for the year, its best year since 1997. The Dow had 71 new closing highs, the most in a single calendar year. The index rose for nine consecutive months, its longest streak of monthly gains since 1959. The S&P 500 posted a total return of 22%, its best yearly gain since 2013. Just like the Dow, the S&P also had nine consecutive monthly gains, the most since 1983. The Nasdaq Composite Index was the real standout performer in 2017, rising 29% on a total return basis.
Driven by the FANG stocks
The strong gains in the stock market were driven primarily by technology stocks; in particular, by a relatively narrow group of tech stocks, the so-called FANG stocks: Facebook, Amazon, Netflix, and Google (now called Alphabet). The best performer among the FANG stocks was Amazon, which was up 56% for the year, followed by Netflix, which gained 55%. Facebook was almost as strong a performer, posting a gain of 53%, while Google was the laggard among the group, though rising a still-robust 36%. Overall, the FANG stocks accounted for about one-third of the gain in the S&P 500 in 2017, making it a very a narrow market. If you didn’t own any of the FANG stocks, given their outsized influence on the market, it’s unlikely you were able to keep up with the index average. However, it wasn’t only the FANG stocks that generated above-average gains. There were some old-economy stocks that did well during the year too. The best-performing stock in the S&P 500 was Boeing, which gained 80% for the year. But not all old-economy stocks did well, as evidenced by GE, which was one of the worst performers in 2017, down 46%.
Bitcoin mania
While the stock market was flying high, its gains paled in comparison to Bitcoin. Bitcoin went from $968 to $14,310, posting a gain of 1,378%! And Bitcoin wasn’t even the best-performing cryptocurrency. In fact, it wasn’t even among the top 10 best performers. (It was 14th.) The best-performing cryptocurrency in 2017 was Ripple, which gained 36,000%! Think about that for a moment. Let’s do some math: Had you put $1,000 into Ripple at the beginning of the year, you’d have $361,000 by year-end! Had you put $100,000 into Ripple, you’d have $3.6 million! Had you put $100,000 into Ripple, you’d have a whopping $36 million! These numbers are truly staggering. Notice, however, that I didn’t say “had you invested.” That’s because we believe that putting money into cryptocurrencies is not investing but rather speculating. And speculating was rampant in 2017. For those of you who are cryptocurrency junkies, Etherium was the sixth-best performer, up 9,162%. Litecoin was the ninth-best performer, gaining 5,046%. There is now a ridiculously large number of cryptocurrencies (1,384 as of this writing).
The topic of Bitcoin and cryptocurrencies seemed to be everywhere in 2017 – on CNBC, in The Wall Street Journal, on the cover of Barron’s, and in the popular press. As an emerging phenomenon, Bitcoin has triggered much confusion and debate. With questions swirling around about whether it’s a fad, a fraud, a Ponzi scheme, a bubble that will eventually burst (potentially bringing down the financial system with it), or an idea that will eventually change the world – a true paradigm shift – we feel it’s definitely an important topic to cover. To that end, we will be releasing an educational piece on it in the near future. For now, we would simply note that Bitcoin mania was illustrative of the zeitgeist in 2017. Is the rampant speculation we’re seeing in Bitcoin a harbinger of doom? Stay tuned for more on that. But for now, let’s return to the stock market...
A smooth flight
The flight of the lamassu was a smooth one. A defining feature of the stock market in 2017 was the absence of volatility. On average, in any given year, the stock market typically experiences a 10% correction. However, 2017 was unusual in that we didn’t have one. Not only didn’t we experience a 10% correction; there wasn’t even a 5% pullback. And yet, 5% pullbacks are quite common in bull markets. On average, we typically experience three 5% pullbacks in any given year. We haven’t even had a modest 2% dip since President Trump was elected in November of 2016. In fact, at no time during 2017 did the S&P 500 drop below its 2016 close.
A popular measure of volatility is the CBOE Volatility Index, known as the VIX, which measures the expected volatility implied by option prices. The VIX hit a new low in December and never once closed above its long-term average during the year. An exchange-traded note that bets on a decline in the VIX tripled during the year.
And yet … there was a lot to worry about
The smooth ride of the stock market was especially unusual in that there were a lot of geopolitical risks to worry about in 2017 (and there still are) – North American trade tensions, a potential Russia-NATO conflict, a potential South China Sea conflict, United States–China tensions, a possible escalation of war in Syria and Iraq, a worsening of Brexit negotiations and fragmentation in Europe, the possibility of conflict in the Gulf, and the most troubling worry of all: the possibility of a nuclear conflict with North Korea. And let us not forget about the ever-present threat of cyberattacks and terrorism.
Not only was there a lot to worry about on the geopolitical front, there was lot to worry about here at home, too, with the chaos in Washington. We should state upfront and unequivocally: This is not a political commentary. Our views on Washington and the political scene are merely in relation to the impact these topics have on the economy and the investment markets. However, it seems fair to say that with the Russia investigation (which has already resulted in indictments and guilty pleas for former Trump team members), talk of impeachment and the possibility of invoking the 25th Amendment, substantial turnover within the Trump administration (at last count, 36 people), to name just a few items, chaos seems to be an appropriate word for Washington. And yet, even with numerous geopolitical risks and chaos in Washington, the lamassu remains aloft, climbing higher and higher, without the slightest bout of volatility along the way.
It’s the economy
What’s driving such a strong stock market with virtually no volatility? Many observers have attributed it to Trump. There seems little doubt that the Trump administration’s policies of deregulation and tax reform have been looked upon favorably by investors. Both consumer confidence and business confidence are up. Tax reform, which is likely to boost economic growth and corporate profits, is viewed as a positive for the stock market. But we can’t give Trump all the credit. The forces shaping this economy were in place long before Trump was elected – namely, three rounds of quantitative easing by the Federal Reserve, extraordinary measures designed to catalyze and sustain an economic recovery in the wake of the global financial crisis in 2009. These unusual actions have succeeded, and the economy is now hitting on all cylinders. We’re seeing the payoff now from seeds planted much earlier than 2017.
Global synchronized expansion
It’s not just the U.S. economy that’s doing well. We’re experiencing what economists call a global synchronized expansion, which simply means that every region around the world is growing. All 45 countries tracked by the OECD are growing. This is unusual. We haven’t experienced such broad-based growth globally since 2010. It seems that while the United States’ economy was the first to recover from the financial crisis and Great Recession, largely because of the extraordinary measures put in place by the Fed, other economies around the world whose central banks eventually followed the U.S. playbook, though somewhat belatedly, are finally catching up. Stock markets around the globe have reacted. The flight of the lamassu is a global phenomenon. International developed stocks, as measured by the MSCI EAFE Index, posted a total return of 26% in 2017, outperforming U.S. stocks for the first time since 2012. Many foreign markets finished at either near-record highs or multiyear highs (e.g., Japan, U.K.). Emerging market stocks did even better, with the MSCI Emerging Markets Index gaining 38% in 2017.
Where do we go from here?
We’re now in the eighth year of a bull market, with the S&P 500 having gained 376% since the low of March 9, 2009. This represents an average annual return of 19%. If that’s not a bull with wings, I don’t know what is. With gains like that, can the market continue higher? Will the lamassu remain aloft? To answer those questions, let us turn to our economic outlook for 2018 and then a review of stock market valuations.
The economic expansion has averaged 2.2% since 2009. It accelerated to an annualized pace of 3% in the second and third quarters of 2017 and will likely remain at or near that pace in the fourth quarter. We expect this above-trend growth to continue into the first half of 2018 as lower personal and corporate taxes contribute to an improvement in consumer and investment spending. But just how much will the tax cuts add to growth?
Impact of tax reform
Figure 1. Estimated impact on GDP growth in 2018 and 2019 from tax reform bill
|
Advocates of the bill |
0.40% |
|
Goldman Sachs |
0.30% |
|
JPMorgan |
0.30% |
|
Tax Foundation |
0.29% |
|
Penn-Wharton Budget Model |
0.06%–0.12% |
|
Committee for a Responsible Federal Budget |
0.08% |
|
CBO/Joint Commission on Taxation |
0.02% |
|
Tax Policy Center |
0.00% |
As shown in Figure 1, there are a wide range of estimates for the impact of tax reform on GDP growth over the next two years. At the high end, you have advocates of the bill predicting that the tax cuts will add as much as 0.40% to GDP growth. At the other end of the spectrum, you have the Tax Policy Center, forecasting that the tax cuts won’t result in any additional economic growth. We tend to side with Goldman Sachs and JPMorgan, which estimate that the tax cuts will add somewhere around 0.30% to GDP growth. This is a meaningful addition, but it’s not a game changer. Whatever the actual figure, we think the impact of tax reform on economic growth will be modest and will fade over time. As we have written in the past, above-average growth is possible in the short term, but it is not likely to be sustainable over the long term due to demographic trends impacting the labor force participation rate (the retirement of the aging baby boomers) and the low levels of productivity we have experienced in recent years. We expect economic growth to eventually slow back down to 2% again, perhaps as early as the second half of 2018 or in early 2019.
Valuation of the stock market
The S&P 500 currently trades at a price-earnings ratio of 18.2x forward earnings, above its 25-year historical average of 16x. The market is unquestionably expensive.
Figure 2: S&P 500 Valuation Measures
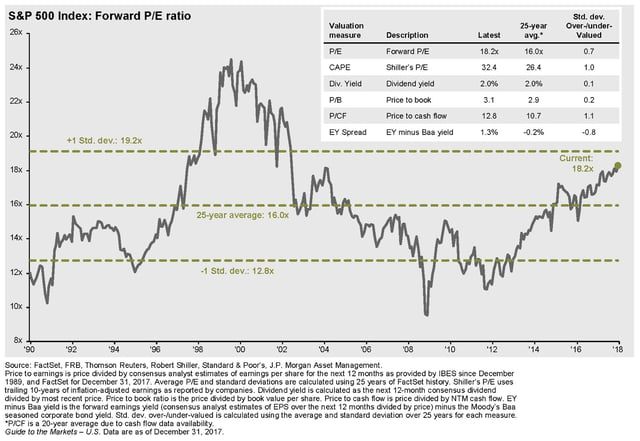
As you can see from Figure 2, the stock market valuation is just shy of one standard deviation (0.7 standard deviations) above its long-term average valuation. Our conclusion is that the market is expensive but not egregiously expensive. We consider anything above one standard deviation, and certainly two standard deviations, to be extreme. We’re not there yet, but we’re getting close. Certainly, at these levels, some caution is in order. However, we remain mindful of the low interest rate environment we’re in and the favorable economic backdrop supporting these valuations. The economy has been accelerating lately. And with the tax reform bill in place now, we should see a further acceleration in economic growth and corporate profits, which we think will drive the stock market higher over time. But we would caution investors that we don’t expect to see the kind of gains we saw in 2017 again in 2018. Instead, we think gains will be much more modest, in the mid-to-high single-digit range. As there is still room for appreciation, though, we continue to maintain a significant allocation to U.S. large-cap stocks. We think small-cap stocks will benefit from an accelerating economy and tax cuts too, but because they are trading at what we think are extreme valuations, we have chosen to avoid them for now.
We expect the economic momentum globally to continue in 2018 as well. With foreign economies still behind the curve in their recovery relative to the United States, we think they have a lot more room yet to improve, even as foreign central banks begin their own process of normalization (reducing their accommodative monetary policy by raising interest rates and reducing their balance sheets). As a result, we continue to find international stocks attractive. Not only are they likely to continue to benefit from the ongoing global economic recovery, but they’re cheaper than U.S. stocks, which makes them especially attractive by comparison.
Expect air pockets along the way
While we expect the lamassu to remain aloft in 2018, we would caution investors to expect air pockets along the way. In contrast to 2017, we think we will see some volatility crop up at some point this year. Who knows what will trigger it? But whatever it is, we think a pullback or correction will likely be temporary. Recall that volatility is a normal part of a bull market. With a healthy economy and no recession in sight, we will likely use such volatility as a buying opportunity.
Fixed income – stay short, focus on credit
Our focus so far has been on the stock market. What about the bond market? The bond market offered investors some surprises in 2017 too. At the beginning of the year, many market observers expected interest rates to move higher. And short-term interest rates did increase, as the Federal Reserve raised the federal funds rate three times during the year. However, longer-term interest rates didn’t follow suit; they actually declined. The yield on the 10-year Treasury note closed the year at 2.409%, down from 2.446% at end of 2016. The Barclays Aggregate Bond Index, which is a broad-based bond market index, posted a positive return of 3.54% in 2017. While this was a modest return, as compared with the outsized gains achieved by the stock market, the fact that it is a positive return in a year when many investors expected rates to go up could be considered a victory. Corporate bonds were up 6.42% for the year. Municipal bonds (10-year) climbed 5.83%. High-yield bonds were the standout performer in the fixed income area, posting a total return of 10.4% in 2017.
A recession looming on the horizon?
With short rates rising and longer rates declining, this served to flatten the yield curve. The difference between the yield on the 10-year Treasury and the two-year Treasury was cut by more than half, from 120 basis points to just 51 basis points. This is a potentially worrisome trend for investors because the yield curve moved closer to being inverted. An inverted yield curve is a notorious signal of a recession looming in the future. This is certainly something to watch, but the yield curve remains positive for now. And there is a strong case to be made that longer-term yields have failed to move up, despite the strengthening economy and the expectation of rising inflation, due to foreign demand for U.S. Treasury bonds, because U.S. yields remain higher on a relative basis than other key benchmark yields, such as those in Japan and Germany. In short, there are structural reasons why the yield curve is so flat right now. It’s not necessarily a signal of a pending recession.
The consensus expectation is for three more rate hikes by the Fed of 0.25% each in 2018, bringing the federal funds rate to 2%. Some strategists think we might get four rate hikes, for a 1% total increase in the federal funds rate. If the 10-year Treasury yield stays flat at 2.4%, then the yield curve could come very close to inverting (and even actually invert). This is something we will be watching carefully. However, our expectation is that the 10-year Treasury yield and other long-term rates will move higher in 2018.
One of the concerns we have about the tax reform bill longer term is the impact it is likely to have on the deficit and the national debt. Estimates of the impact range from $1.4 trillion to $2.2 trillion on a static scoring basis. On a dynamic scoring basis, which takes into account the estimated impact of tax reform on economic growth, the estimates are lower, but they’re still high, ranging from $448 billion to $1.8 trillion, with most somewhere in the $1 trillion to $1.5 trillion range. Without an offset from spending cuts, additions to the debt like this are likely to result in higher interest rates over time.
Defensive posture
We have positioned our fixed-income portfolios defensively, with an eye toward protecting them against rising rates by shortening the duration and focusing on segments of the bond market that are credit oriented and less interest rate sensitive, such as structured credit (e.g., mortgage-backed securities, asset-backed securities), floating rate notes, inflation-protected strategies, and short-duration high-yield municipal bonds. With the strong run in high yield over the past few years and the narrowing of credit spreads, which is a sign of a healthy economy but also extended valuations, we have reduced our high-yield exposure substantially. With the headwind of rising rates, we expect returns for the bond market to be driven strictly by coupon income alone, with no expectation of price appreciation. This means low single digits at best.
Summary of our outlook for 2018
We would characterize our overall outlook for 2018 as bullish but cautious.
- No recession will occur in the next 12 months.
- Our base case scenario calls for above-trend economic growth to continue in 2018.
- Tax reform will add to growth, but modestly, and the impact will fade over time.
- The global synchronized expansion should continue.
- Interest rates will rise gradually and modestly.
- Inflation will begin to rise, though modestly.
- We could see a boost to the dollar from faster growth and rising rates.
- We have concerns about the deficit longer term.
- The stock market will move higher over time, driven by continued economic growth and the boost to corporate profits from tax cuts, but with no valuation multiple expansion. Expect mid-to-high single-digit returns.
- The bond market, facing the headwinds of rising rates, should deliver coupon-like returns (low single digits).
Current portfolio positioning
- We are overweight stocks versus bonds.
- We are still positive on U.S. stocks but cautious due to high valuations.
- Small-cap stocks are overvalued; avoid them for now.
- International and emerging market stocks are attractive. They benefit from global growth and have favorable valuations.
- Expect a pullback or correction at any time, but it will likely be temporary. Use it as a buying opportunity.
- With inflation and interest rates headed higher, focus on short-duration, structured-credit, inflation-protected, short duration high-yield municipal and floating-rate bond strategies.
- REITs are fairly valued, but there are pockets of opportunity.
For now, the lamassu remains aloft, likely to fly higher in 2018. But we don’t expect the same type of outsized gains in 2018 as we saw in 2017. And we’re mindful that the flight of the lamassu, like all things, will eventually come to an end (just as the great stone statues outside Mosul finally did after 3,000 years). Our advice is to stay diversified. There are many global macro risks to consider. We’re in the late-cycle phase of the economic expansion. Rest assured that we will be watching the economic data and valuations carefully. We remain cautious, focused on protecting our clients’ hard-earned capital while striving to grow it at the same time.
As I pondered the incredible performance of the 2017 stock market, which has continued to climb higher so far in the first few weeks of 2018, I wondered if there were any other examples in history of a winged bull besides the lamassu – more contemporary examples. Ah, yes! There is one. This is one of my favorite winged bulls.

As always, we appreciate your trust in us as stewards of your wealth, and we thank you for your business. Should you have any questions, we invite you to call or schedule a meeting with your First Foundation Wealth Advisor.