Welcome to our financial education resource, covering key topics in financial services, including terminology, trends, and strategies shaping the investment and banking industries. We have developed this resource to empower you to make informed decisions about your finances and be better prepared when working with your advisor and/or banker.
While today’s political and market uncertainties can make investors feel ill-at-ease, it’s important to remember that the U.S. stock market has recovered from every decline it has faced, and is likely to provide investors with positive results—if they can keep their long-term perspective.
In the past 35 years, the market has experienced an average drop of 14% from high to low during each calendar year, but still had a positive annual return more than 80% of the time.
Earlier this year, before volatility stuck out its ugly head, we compared the stock market’s rise to the flight of the lamassu – a mythical bull with wings from Mesopotamia. The lamassu certainly had its wings clipped over the past several months as volatility came back with a vengeance.
Does the presence of renewed volatility mean you should cut back on your stock market investments? In my opinion, it does not. If anything, it has given more opportunities for investors to use the see-sawing of the stock market to seize on buying opportunities to buy low. What’s more, 2018’s higher volatility has simply counteracted 2017’s extremely low volatility. We should be thanking volatility for bringing the market back.
On average, in any given year, the stock market typically experiences a 10% correction. However, 2017 was unusual in that we didn’t have one. Not only didn’t we experience a 10% correction; there wasn’t even a 5% pullback, as pointed out in our market outlook for 2018. And yet, 5% pullbacks are quite common in bull markets. On average, we typically experience three 5% pullbacks in any given year.
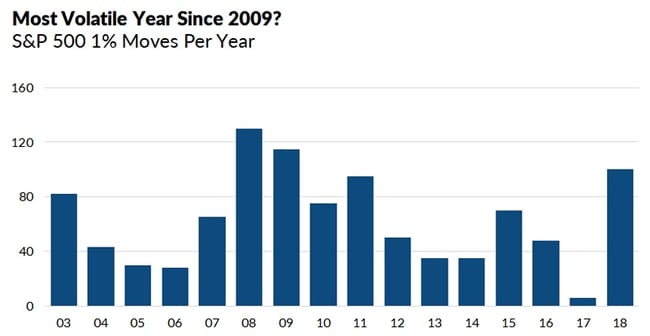
Fast forward to 2018, we have already seen the market drop 10% by February 8, only to gain back more than 5% in March, then plunge right back down to a low for the year in March. It was a volatile first quarter. Just to put the first quarter into historical perspectives, the S&P had 23 days with a 1% move in Q1 2018. The historical average for the past 60 years is for 13 such sessions over that period. So, from that perspective, the market appears more volatile.
But if you take that 23 days and annualize it to all of 2018 (see chart below), the year was indeed more volatile but not much more than other years. In fact, 2008 and 2009 were more volatile, and given that 2017 had such low volatility, 2018 looks to be a normal year.

Source: CNBC
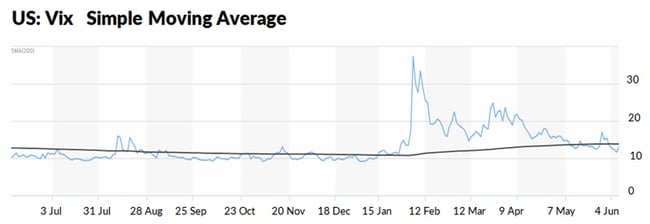
Another thing to watch is the CBOE Volatility Index, known as the VIX and popularly referred to as the Fear Index, which measures the expected volatility implied by option prices. The VIX hit a new low in December 2017 and never once closed above its long-term average during the year. This year, it been above its 200-day moving average virtually the whole year (see chart below).

Source: Marketwatch
Is there anything on the horizon that could impact volatility this year? Well yes, there is the threat of a trade war, but I don’t think that is likely. Then there’s the Russia investigation, the fact that the Federal Reserve could slip up by either raising rates too quickly or not enough, the threat of higher inflation and there’s the midterm elections. Either of these could lead to spikes in volatility in the short run. More importantly, once second-quarter earnings come in, if earnings are not stellar especially amid the FAANG stocks (Facebook, Apple, Amazon, Netflix and Google), volatility once again could spike.
Regardless, I believe that the economy is much more important to the strength of the overall market, and all indicators so far have pointed to continued growth in the economy. Our base camp scenario calls for above-trend economic growth for the rest of 2018, and for the global synchronized expansion to continue for the foreseeable future. We see interest rates rising gradually and inflation already beginning to rise, though modestly.
So, when you hear volatility is spiking, consider that as a buying opportunity to invest in a growing economy. For positioning your portfolio, we continue to overweight stocks versus bonds, we think small-cap stocks continue to be overvalued. We see opportunities in both international stocks and emerging markets stocks, as we feel they could benefit from the global expansion and possibly from the war on trade if it comes to that.
Overall, the S&P 500® has been on an upward trend since 1980, showing a positive return in 32 out of the 38 years, which is nearly 84% of the time. Market declines throughout the year are normal. Despite those losses, markets recover and post gains.
As pointed out in February’s market action update, we have a lot of experience dealing with market volatility. Suffice it to say, we’ve been here before. We’re fairly confident that the market today is simply the return of “normal” volatility. After such a long upward trajectory with virtually no volatility, the market needed to take a breather. None of this is to say that things can’t get worse in the short-term. “Normal” volatility can mean a decline of 5-10% or more. We would caution investors to always be prepared for something like that. However, we think such volatility will prove to be temporary. No matter what, though, our focus on diversification and asset allocation is designed to help manage volatility should it continue.


