
It’s been eight years since the financial crisis and Great Recession. The economy seems to be humming on all cylinders. We have experienced remarkably little volatility in the financial markets, despite a swirl of chaos in Washington, a string of deadly natural disasters, and unusually high geopolitical risk. From hurricanes, earthquakes, and wildfires to a tragic shooting to the existential threat of nuclear war to more mundane issues like a massive data breach and a Hollywood mogul’s rapid fall from grace, the world seems to be crazier than ever. And yet, throughout all this, the stock market keeps hitting new highs. Consumer and business confidence remain high. How much longer can we go before we experience another recession and bear market? In this issue of our Quarterly Update and Outlook, we peer into our crystal ball and attempt to provide some answers.
The lost art of scrying
A quiet room. Burning candles and incense. A relaxed atmosphere. I enter a meditative state. I begin with the traditional rituals, just as the instructions suggest. I want to do this right. I grab the crystal ball – a four-inch clear quartz orb sitting on a little black pillow in front of me – and attempt to energize it. I put the ball back down gently on the pillow. With a soft gaze, I peer into it. I let my eyes go in and out of focus. I clear my mind and concentrate on feeling open and receptive …
In an effort to predict the economic future, I’ve decided to try crystal ball gazing. I know what you’re thinking. This is not rational behavior for an educated and experienced money manager. That’s what I’m thinking too! But I’ve discovered that there’s more to crystal ball gazing than you might think. The practice is officially called scrying, and it’s a lost art. Most everyone is familiar with the image of the gypsy fortune-teller gazing into a crystal ball to divine a person’s future. There is a common misperception that crystal balls have a magical power to foretell the future. However, that’s not how they work at all. They aren’t for foretelling future events, but rather uncovering images buried in one’s unconscious mind. Correctly used, they are said to induce a trance-like state that dissociates one’s consciousness, enabling information from one’s subconscious to pass through to the mind’s eye. It is in the mind’s eye that images are seen, not in the crystal ball. Or so they say, anyway.
My eyes come back into focus. The ball is as clear as ever. I suddenly have an insight! It worked! The answer is unequivocal. I’ll now share with you the sole thought that relates to the question at hand: where is our economic future headed?
“We will have a recession and a bear market sometime in the next five to seven years.”
That’s it! That’s my insight. That’s the economic fear buried in my subconscious.
I’m just kidding about all this, of course. I didn’t really engage in scrying. I don’t own a crystal ball. I do have a small crystal globe that sits on my desk that looks sort of like a crystal ball, but that’s different. But if I did peer into a crystal ball and ask the question about where the economy is headed, I’m pretty sure that’s the answer I’d get. The fear of a recession and a bear market is definitely lurking in my subconscious. In fact, it’s often in my conscious mind too!
Money manager humor
There’s an old joke that we money managers often rely on when asked where the economy and the markets are headed. We respond by saying, “I don’t know. My crystal ball is cloudy,” or – my favorite variation – “My crystal ball is in the shop.” Clearly, money managers aren’t known for their sense of humor. But why do we joke like this? Because predicting the future is so difficult – indeed, nearly impossible – that it requires almost magical abilities (or a magical crystal ball, which of course we know doesn’t exist). The fact is, predicting the future is hard not only for the lay person, but even for highly trained and experienced money managers with sophisticated economic and market research tools at their disposal. And so, when asked to predict where the economy and the stock market are headed, our first response is often to defuse the tension of the moment by making a joke about it. But then, we quickly return to being serious, realizing that despite how hard it is to predict the future, we’re required to do so anyway. Our clients almost demand it.
And so, what are the prospects for the next recession or bear market? Forget the crystal ball; what does our research, as imperfect as it may be, have to say about the outlook for the economy and the stock market?
I commented to a client recently that “We don’t see a recession anywhere in sight.” This prompted the client to ask, “What indicators do you look at to try to predict a recession?” I thought to myself, “That’s a fair question.” It got me thinking that we don’t often share with our clients how we do what we do. We’ll make a statement such as, “We don’t see a recession anywhere in sight,” often without telling them how we arrived at that conclusion. And so, we devote this issue to sharing with you some of the indicators that we look at to try to predict the future. And, no, the process doesn’t involve scrying.
The Big Five
If you’re lucky enough to have been on an African safari, you know that the “Big Five” are the lion, elephant, buffalo, leopard, and rhino. They’re a must-see on a safari. But I’m not talking about game animals or safaris. I’m talking about the “Economic Big Five.” There are a lot of economic indicators to consider when trying to predict a recession, and of course there is much dispute about which are the most important, but here are five indicators that we think are some of the most important to watch. We watch many more than just these, but in the interest of brevity, we have narrowed the list down to the Big Five.
Some of the Big Five are financial market indicators, while others are economic activity indicators. What most of them have in common, however, is that they’re forward-looking. Financial market indicators tend to work well because investors are forward-looking. Most indicators of economic activity, on the other hand, are coincident indicators, or even lagging indicators, which makes them less useful (or in many cases downright useless) as predictors of the future. However, some economic indicators are forward-looking. Let’s begin with the financial indicators first.
- The slope of the yield curve – the difference between the yields on short- and long-term bonds (e.g., the yield on the 10-year Treasury note less the yield on three-month T-bills) is one of the most watched indicators by economic forecasters. The rule of thumb is that an inverted yield curve (when short rates are above long rates) indicates a recession in about a year. A flat curve indicates weak growth and, conversely, a steep curve indicates strong growth. This is a fairly reliable indicator. Yield curve inversions have preceded each of the last seven recessions, including the most recent Great Recession. The yield curve inverted in August 2006, a little over a year before the recession began in December 2007. However, this indicator is susceptible to false positives. There have been two notable false positives: an inversion in late 1966 and a very flat curve in late 1998. This susceptibility to false positives is why economists often joke that the yield curve has predicted nine of the last seven recessions. (Economist jokes are even worse than money manager jokes!) Figure 1 shows the slope of the yield curve and GDP growth.
Figure 1. The yield curve and predicted GDP growth
As you can see, the yield curve inverted in late 2006, a little more than a year before the recession. It then turned positive again in 2008, before the economic recovery began in 2009. But it became increasingly less negative as time went on, and eventually, when it turned positive, it continued to become even more positive, suggesting that a recovery was about to unfold. Since then, we’ve had a positive yield curve, albeit a flattening one over time. As of September, the slope currently stands at 122 basis points, up slightly from 118 basis points in August and 116 basis points in July. The Federal Reserve Bank of Cleveland, which tracks the slope of the yield curve and other indicators of recession, puts the probability of a recession, based on the yield curve indicator, at 12%. This is down slightly from 12.5% in August and 12.9% in July. Based on this typically reliable indicator, the risk of a recession is not zero, but it’s very low.
- Credit spreads – the yield on BBB corporate bonds less the yield on the 10-year Treasury is another good indicator of an economic downturn. Credit spreads – like all financial asset prices – are forward-looking, and thus they contain important information about the economy. They capture investors’ views on the current stance of monetary policy, which has an important impact on economic growth. They also incorporate investors’ expectations of future corporate defaults, which is a reflection of the health of the business sector and the overall economy. Like the slope of the yield curve, this indicator is also quite reliable, but nevertheless has had a few false positives (predicting a recession that didn’t occur) and false negatives (failing to predict a recession that did occur).
Beginning in summer 2015, credit spreads began to widen. They continued to widen throughout the rest of the year and into early 2016 as oil prices declined sharply and investors became concerned about global growth prospects due to a slowdown and possible currency devaluation in China. By February 2016, credit spreads had shot up from a low of 143 basis points the summer before to 303 basis points. The Fed’s credit spread model implied a 55% chance that the U.S. economy would enter a recession at some point over the next 12 months. However, investors’ concerns abated in March, causing credit spreads to begin narrowing again, thereby lowering the odds of a recession significantly. A recession was avoided. Credit spreads currently stand at 133 basis points, signaling a low probability of a recession over the next 12 months.
- Initial jobless claims (and other employment indicators) – nearly every economic cycle since 1967 has shown the same pattern – jobless claims bottom approximately one year before a recession begins. For the week ending October 7, jobless claims declined by 15,000 to 243,000. This represented a return to levels prior to the temporary spike caused by hurricanes Harvey and Irma. Jobless claims are up from the low in March of this year and about even with year-ago levels, which is a bit worrisome. However, the weekly data tend to be volatile, making it hard to discern a pattern. The 4-week moving average, a less volatile measure than the weekly figure, showed a decrease of 11,500 from the previous week’s average. The previous week’s average, in turn, was revised downward as well, by 10,500. Based on the 4-week moving average, the continued decline in jobless claims is a good sign, suggesting that a recession is not likely over the next year. However, jobless claims are at very low levels, and thus this indicator bears close watching.
- Purchasing Managers Index (PMI) – the Purchasing Managers Index (PMI), specifically the manufacturing PMI, put out by two different data providers, IHS Markit and the Institute for Supply Management (ISM), is another widely followed indicator of economic growth and, hence, risk of recession. It represents an indicator of manufacturing activity in the economy. Even though manufacturing has declined in the U.S. over the years to the point where it now represents only about 12% of GDP, it nevertheless remains an important indicator of the health of the overall economy. A PMI reading above 50 represents expansion, while a reading of below 50 indicates contraction. The IHS Markit PMI was 53.1 in September, up from 52.8 in August. The ISM Manufacturing PMI for September was 60.8, up from 58.8 in August. Both indicators have remained above the threshold level of 50, indicating expansion, for more than a year. This is a good sign, suggesting that a recession is not in the cards anytime soon.
- Leading Economic Indicators Index (LEI) – the LEI, published monthly by the Conference Board, an independent research organization, is designed to predict the direction of global economic movements over the next several months. It is made up of 10 economic components whose changes tend to precede changes in the overall economy. These 10 components include:
1. Average weekly hours worked by manufacturing workers
2. Average number of initial applications for unemployment insurance (jobless claims)
3. Manufacturers’ new orders for consumer goods and materials
4. ISM Index of new orders
5. New orders for capital goods unrelated to defense
6. New building permits for residential buildings
7. The S&P 500 stock index
8. Inflation-adjusted monetary supply (M2)
9. The spread between long and short interest rates (the slope of the yield curve)
10. Consumer sentiment
As you can see, some of the components of the LEI are members of the Big Five, such as the slope of the yield curve, jobless claims, and several PMI-related indicators. While these are components of the LEI, because they are such important indicators, we watch them independently as well. However, the LEI is a good indicator because it represents a composite of indicators and thus it removes the noise associated with any one indicator. A decline in the LEI of three consecutive months is a sign that a recession might be on the horizon. In 2015, the LEI declined two months in a row, causing fears of a pending recession. This proved to just be a scare, as the LEI subsequently turned positive again. The most recent LEI declined 0.2% in September, but the decline is likely due to the impact of the recent hurricanes and therefore temporary. The trend in the LEI remains positive with a gain of 0.4% in August, 0.3% in July, and 0.6% in June. The LEI, which is forward-looking by definition, indicates that the economy remains healthy.
All five of the Big Five paint a picture of a healthy economy, with a recession unlikely over the next 12 months. A majority of economists – 34 out of 57 – polled by Reuters expect the economic expansion to continue for at least two more years. Of those polled, 13 think the expansion will last three years. But we’re not willing to make predictions that far out. Beyond 12 months, the Big Five have little value. Looking out that far, our crystal ball truly does get cloudy. We’re mindful that at 99 months, this is the third-longest economic expansion on record since 1900. And yet it’s been a tepid expansion, with very slow growth compared to past recoveries. With continued slow, but steady, growth, the expansion could continue for a few more years, making it the longest expansion on record.
Lurking in the back of my subconscious, however, is that nagging feeling that while the expansion could go on for another year or two – or maybe even three – it can’t possibly go on for five to seven years. It seems inevitable that we will experience a recession at some point within that time frame. After all, since we’re now already eight years into this recovery, if the expansion were to last five to seven more years, it will have lasted 13-15 years! I suppose we can never say never, but that just seems highly unlikely. This prediction seems so obvious that you don’t need a crystal ball to make it.
Expansions don’t die of old age
This expansion is getting long in the tooth. And yet, at the same time, we’re reminded of the adage that “expansions don’t die of old age.” Fed Chair Janet Yellen has made this point several times. This is not just a throwaway line. There is research to back it up. A study conducted by the San Francisco Fed indicates that as the length of an expansion increases, the probability of a recession doesn’t necessarily increase. However, this was not always the case. Prior to World War II, the length of an expansion was a determining factor. But since then, things have changed. The shift away from a manufacturing-oriented economy to a service-oriented economy is probably the principal reason for this change.
While we’re fairly confident that based on the Big Five (no crystal ball necessary), a recession is not likely over the next 12 months, rest assured that we will be watching the Big Five carefully for signs of a change. This is no time for complacency. Just when things seem all too rosy is when complacency can set in.
What will wake the bear?
What about a bear market? What indicators do we look at for guidance on that? To clarify, a bear market is defined as a decline of 20% or more from the previous high. We’re not talking about pullbacks or contractions. Pullbacks are defined as a 5% decline. They’re quite normal, even in bull markets. On average, there are three pullbacks in any given year of a bull market (defined as a market that ends the calendar year higher than the previous calendar year). Now, what’s interesting, and a bit troubling, is that we haven’t had a pullback at all so far this year. We expect that one could occur at any time. They’re quite normal, and we don’t worry about them. As a matter of fact, we worry more when they don’t happen. Corrections are defined as 10% declines. These too, believe it or not, are fairly common. On average, we get at least one correction per year, even in bull markets. And yet, we haven’t had a correction either in quite some time. We did experience one at the beginning of 2016, but the market subsequently recovered and has gone on to make new highs without a correction since. And so, like pullbacks, we think we’re overdue for a correction. They’re not fun, that’s for sure. But they’re normal. Again, we could have one at any time. But while pullbacks and corrections are normal, happening fairly frequently, bear markets are an entirely different story. They are relatively rare – and exceedingly painful for investors – which is, of course, why we want to be hypervigilant about the prospects for one.
Based on research done by JPMorgan, we find that bear markets tend to occur because of one or more of the following factors:
- A recession
- A spike in commodity prices
- An overly aggressive Fed (tightening monetary policy by raising interest rates too quickly or other means)
- Extreme valuations
Figure 2. Bear Markets and Subsequent Bull Runs
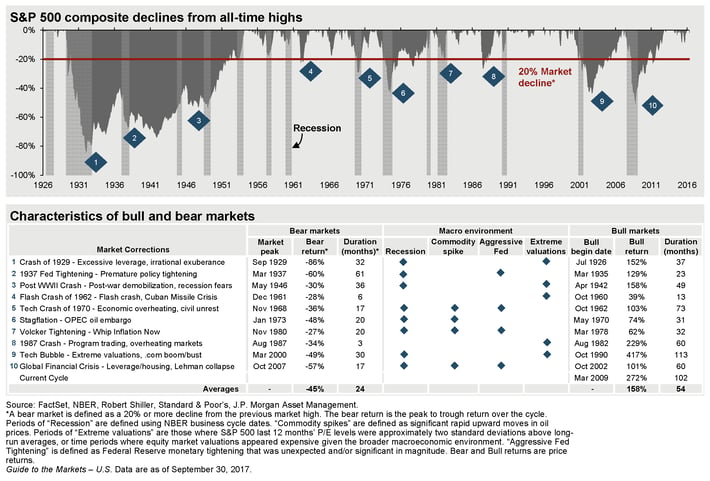
Figure 2 shows the last 10 bear markets and the conditions associated with each (e.g., recession, commodity spike, aggressive Fed, extreme valuations). As you can see, the most common condition associated with bear markets is a recession. Eight of the last 10 bear markets have been associated with recessions. As we discussed, the Big Five suggest that a recession isn’t likely over at least the next 12 months, so on this measure at least, a bear market seems unlikely.
What about the other conditions? It seems as though we can dismiss a spike in commodity prices fairly easily. With increasing U.S. shale production, OPEC struggling to maintain its production cuts, slowing demand from China, and technology and efficiency improvements, we think oil prices will stay in a trading range of $45-$60 for at least the next year.
How about the Fed? This is where things get interesting. The Fed is in the process of raising interest rates. They have raised the Federal Funds rate four times so far, and are signaling another rate hike in December. But the rate hikes have been very gradual and modest. We expect this to continue to be the case. With continued slow growth and still low inflation, especially wage inflation, we think the Fed will maintain a slow and steady policy of interest rate hikes. Regressing stock market returns on 10-year Treasury yields indicate that when yields are under 5%, stock market returns tend to be positive. Our conclusion is that the stock market can continue to advance even in a rising rate environment, as long as rate hikes are gradual and longer-term rates remain relatively low, even if rising. However, the one concern on everyone’s mind is the Fed’s announcement that it will begin the process of reducing its balance sheet holdings, which have built up to over $4.5 trillion as a result of three rounds of quantitative easing. This process of reducing the balance sheet is known as “normalization.” A buildup like this of the Fed’s balance sheet has never occurred before and, therefore, neither has the process of unwinding it. This is uncharted territory here, and it’s unclear what the impact will be. It stands to reason that if three rounds of QE helped kick-start and sustain the economic recovery, unwinding the QE could curtail economic growth. With our current slow growth rate, this is a bit worrisome. Moreover, reducing the balance sheet means an increase in the supply of bonds, which could result in lower bond prices and rising interest rates. However, the Fed seems to understand the gravity of such an unprecedented move and appears committed to reducing the balance sheet very slowly and gradually.
The Fed’s plan
The Fed released a plan in June to start small, unloading $10 billion worth of assets a month and then scaling up gradually over time until it is shedding $50 billion a month by October 2018. For now, the plan involves simply reinvesting fewer maturities, rather than the outright sale of bonds. At its September meeting, the Fed announced it would begin the process in October and provided more details about the program. For Treasury securities, the Fed will lower purchases by $6 billion per month initially and gradually increase in steps of $6 billion until reaching $30 billion per month. For mortgage backed securities, the cap will be $4 billion per month initially and will increase in steps of $4 billion until reaching $20 billion per month. We recently released an educational piece about the Fed’s plan for reducing its balance sheet titled “Going on a Diet: Cutting Back on Desserts from Three to Two.” We think the gradual path toward normalization that the Fed has laid out will enable the economy to avoid a recession over the next year, despite tightening monetary conditions. And we think the Fed’s transparency and go-slow approach will keep investors calm, thereby helping avoid a bear market. But since the process of normalization is unprecedented, it bears watching very carefully.
Valuations
Of all the factors associated with bear markets, the valuation of the stock market is our biggest concern right now. With a price-earnings ratio of 17.5x, the S&P 500 is trading at about 0.5 standard deviations above its 25-year average valuation of 16x. This is high, for sure, but not yet extreme. Caution certainly seems in order and, in fact, we’ve been raising some cash in our asset allocation strategies by trimming our exposure to U.S. stocks lately, thereby reducing risk. We are holding this cash as “dry powder” that can be put to work opportunistically, should a pullback or correction occur. But while we’re cautious and have raised some cash as a result, at the same time, we don’t think a full-blown bear market is likely over the next year. Although it’s certainly possible to have a negative one-year return with valuations where they are, our research indicates that it’s relatively rare to have a bear market, especially without other factors contributing to it. In general, bear markets don’t happen merely because of overvaluation alone. They typically occur when there is a combination of factors – such as a recession, a commodity spike, or an aggressive Fed – along with extreme valuations.
To summarize, with respect to bear markets, we have two warning lights flashing yellow (caution) at the moment. These include the possibility (though not the likelihood) of an aggressive Fed hiking interest rates or reducing the balance sheet too quickly, and the possibility of above-average valuations leading eventually to extreme valuations. Neither of these conditions is in place currently, but they certainly bear careful attention. Most importantly, with no recession in sight over the next year or so, we think the stock market can continue to make some gradual headway, driven not by valuation multiple expansion, but rather by continued growth in corporate profits. Although we’re not holding our breath, should we get tax cuts that would help boost corporate profits further, that would be a positive for the stock market.
Current positioning
Given this backdrop, we remain cautiously optimistic about stocks. We continue to prepare for near-term volatility including a pullback or correction at any time. But we don’t think a recession or bear market is likely over the next 12 months. While U.S. stocks are expensive, prompting us to begin trimming them at the margin and raising some cash in our asset allocation portfolios, we think international stocks remain attractive with cheaper valuations and a longer runway of growth, as foreign economies finally begin to benefit from an expansion of the global economic recovery. With rising interest rates and the uncertainty over the Fed’s balance sheet reduction, we remain cautious on the bond market. We are currently emphasizing certain segments of the bond market, such as floating-rate bank loans, short-duration bonds, inflation-protected securities, mortgage-backed bonds, and asset-backed bonds, which we think provide some insulation from the headwinds of rising interest rates and tightening monetary conditions.
No need for crystal ball gazing. The Big Five indicators all seem to point to a continued healthy economy, at least for the next year. Beyond that, however, it’s too hard to say what will happen. Although expansions don’t die of old age, it nevertheless seems unlikely that we can go five or more years without a recession. Rest assured that we will be watching the indicators very carefully. We have a couple of warning lights flashing regarding the possibility of a bear market, but they’re yellow warning lights – not yet red. And other indicators of a possible bear market remain favorable for now.
Watch the data
If you want to plumb the depths of your subconscious, maybe crystal ball gazing is for you, but in terms of foretelling the future, we’ve found it to be pretty much useless. We’re focused instead on closely monitoring economic and market indicators. If you’re looking for insight into where the economy and the stock market are headed, we suggest putting away that clear quartz orb and tracking the Big Five instead.
As always, we thank you for your continued confidence and trust in us. We appreciate your business. If you have any questions or comments, we invite you to reach out to your Wealth Advisor.