Welcome to “The Week Ahead” where we take a moment to provide our thoughts on what we can expect in markets and the economy during the upcoming week.
Almost a hundred years ago, 1926 specifically, the S&P 90 index was created which tracked 90 companies and was computed daily instead of weekly, which was the standard at the time. In 1957 the index was expanded to include 500 companies, and has since then become the broad domestic equity index which many investors view as the benchmark for their domestic equity portion of their diversified portfolio. Its sector constitution has ebbed and flowed over the years, capturing large broad shifts such as the energy sector expanding to 16% of the index right before the Great Financial Crisis in 2008 to today’s weight of roughly 2.3%. Intra-day, daily, weekly, quarterly, and annually we know that short-term volatility is driven by that moment’s news.
Benjamin Graham, whom many call the father of fundamental investing, once said, “in the short run the market is a voting machine; in the long run, it is a weighing machine.” With the rise of technology, both the flow of information as well as the execution of trading has been democratized to the palm of one’s hand. As such, it seems that business cycles change more quickly and fluidly and for many investors, their investing time horizons have shortened, and timing the market (hello Robinhooders!) is back in vogue. The Fed’s interest policy has worked as intended: pushing investors out of conservative/safe assets. The 10-year U.S. Treasury is now yielding 0.72%. The traditional balanced 60/40 portfolio of 60% stocks and 40% bonds will have a much more difficult time generating the returns of yester-years. Some studies have shown that a 75/25 portfolio may very well be the new 60/40. While we can all live with higher returns associated with more equities, not everyone can live with the volatility associated with those types of returns.
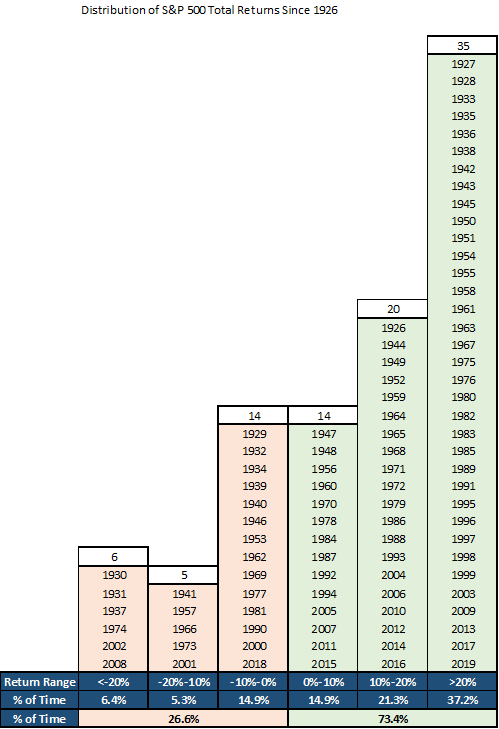
2020 has been unique to say the least, and we all know how volatile the equity markets have been. Looking at annual returns, 2020 has seen five different performance regimes ranging from being down more than -20% (peak to trough the S&P 500 was down 34%) and prior to last Thursday, just inching into the +10%-20% range. With the S&P 500 still positive for the year at +7.50%, now is a great time for one to sit in front of the mirror and reflect:
- How did I sleep during March/April?
- Did I have statement shock at the end of the quarter?
- Did I regret making an emotional decision such as selling my equities and going to cash?
- Did I regret not buying or rebalancing during market lows?
- Have my long-term goals changed?
- Have my short-term goals changed?
- Has my time horizon changed?
- Has my risk tolerance level changed?
- Has my tax situation changed?
- Have my liquidity needs changed?
- Have my unique considerations changed?
- Was my advisor responsive?

Source: Bloomberg, Standard & Poor’s
The week ahead will be relatively quiet after last Friday’s surprising employment report that saw the unemployment rate drop to 8.4%. The economy added 1.37 million jobs in August, which brings the cumulative jobs recovered since March’s shutdown to 10.6 million, or roughly 48% from pre-COVID-19 levels. Many did not expect unemployment to break the 10% barrier until the start of next year. Similar to the initial jobless claims data, we expect continued volatility with these economic data points but for them to continue to trend overall in the right direction, downward. Inflation has been put on the back burner for the time being, as the focus continues to be on the healing of the economy. As we continue to walk the fine line of: work from home/reopening the economy, recovery hopes/recession fears, and inflation/deflation, we expect the emotions of investors to wax and wane and for investors to change their “vote” about what the future bares, more often. But we hold fast to Benjamin Graham’s belief that in the long run the market will recognize fundamentals and “weigh” assets to their correct valuations. Don’t forget to reflect, reposition, and reaffirm your portfolio’s risk and return profile.
Data deck for September 5–September 11
|
Date |
Indicator |
Period |
|
September 8 |
NFIB Small Business Optimism |
August |
|
September 8 |
Consumer Credit |
July |
|
September 9 |
JOLTS Job Openings |
July |
|
September 10 |
Initial Jobless Claims |
---- |
|
September 10 |
Producer Price Index |
August |
|
September 10 |
Wholesale Inventories (Final) |
July |
|
September 11 |
Consumer Price Index |
August |
|
September 11 |
Monthly Budget Statement |
August |


