

5 minute read
Smart insight and clear visuals that matter – what we’re watching now and how intention and conviction shape our portfolios.
Markets
Unanchored Expectations
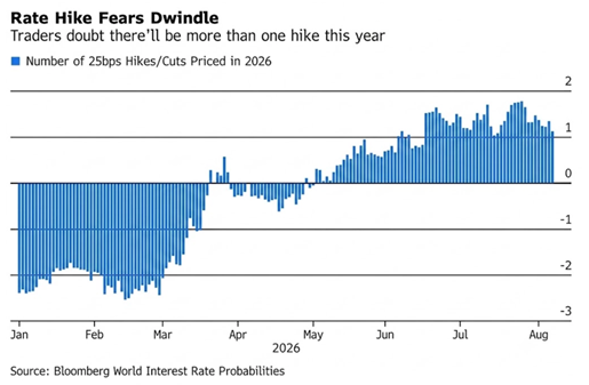
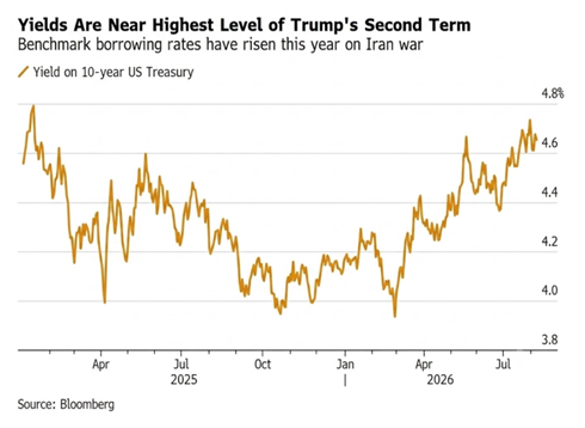
July saw some unexpected price action across equities, rates, commodities, and currencies. On the macro front, in addition to the renewed escalation in the Middle East and higher oil prices, the market grappled with volatility around the near-term Fed policy path and the long-end response to those developments. While the short end of the Treasury curve has begun pricing in a more modest trajectory, that stands in contrast to the rest of the fixed income landscape. We believe the Fed’s pivot away from prescriptive forward guidance may have left the market unusually unanchored regarding the path of monetary policy. Unsure of the Fed’s terminal destination, investors are demanding higher risk premiums further out on the curve, driving longer-term Treasury yields higher as inflation concerns continue to exert upward pressure on long duration.
Commodities
Copper: An Exception to Superabundance
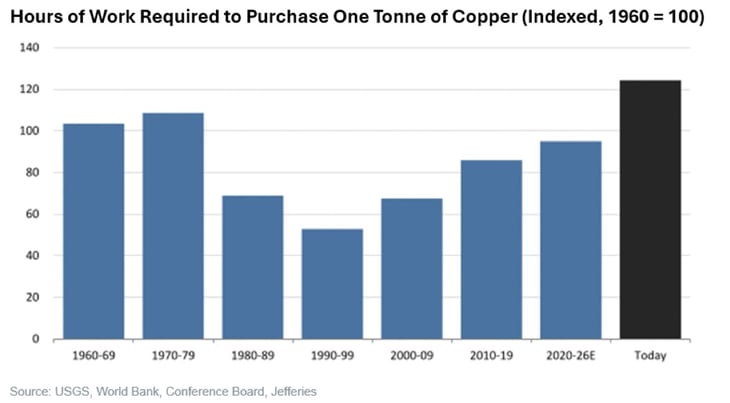
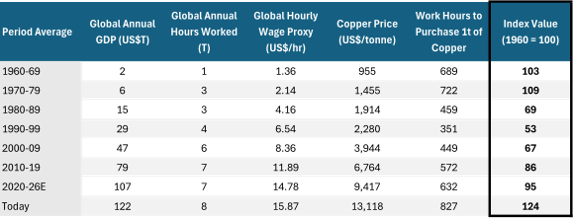
In the 2022 book Superabundance, Marian L. Tupy and Gale L. Pooley argue that population growth ultimately increases the abundance of commodities, goods, and services. The authors introduce the concept of "time prices," which measures the amount of work required to purchase a given product, and show that over time most goods have become increasingly accessible as economic growth has outpaced resource constraints. This describes the story of capitalism. Recent data highlighted by Jefferies suggests copper may be an exception to that trend. Using Conference Board data, they show that the number of work hours required to purchase one ton of copper has been rising, see the chart below, indicating that copper may be becoming relatively scarcer.
For 40 years, the global economy, led in large part by China’s economic growth, was able to expand faster than copper demand. Around 2015, we believe relationship began shifting. As the digital economy and machine learning infrastructure have become increasingly dependent on copper-intensive networks, the data shows that it now takes more hours worked than at any point in recent history to afford a ton of copper. Jefferies believes this dynamic could persist for another five to ten years and is the case for why we have natural resources in the portfolio.
Source: USGS, World Bank, Conference Board, Jeffries
Private Credit
Return of the Banks
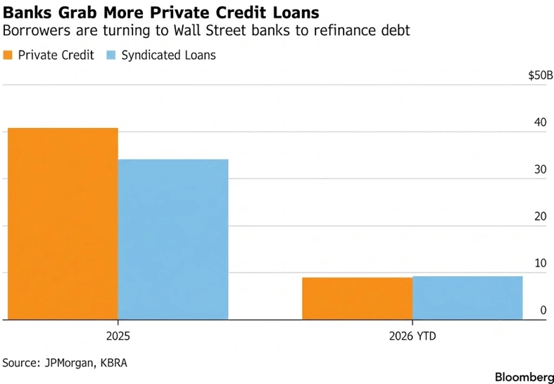
We are observing that highly indebted companies are increasingly ditching private credit loans for cheaper capital in the bank loan market, a shift underscoring the realities of higher-for-longer interest rates. Companies with private debt are refinancing in the syndicated market about three times more often than firms with syndicated loans are tapping private credit (see chart below). This is somewhat to plan as the head of the Office of the Comptroller of the Currency (OCC) said in January that its efforts to relax post-crisis rules for leveraged loans would help banks better compete with private credit.
Firms may also be concerned about private credit lenders’ shrinking levels of capital. Investors for much of the year have been looking to pull money out of private credit funds, and their asset levels broadly declined in the first quarter. Recent quarterly reports from funds overseen by the industry's big players showed that loan health and investor returns are worsening, according to an analysis by The Wall Street Journal. The stress among private-credit borrowers is occurring while the U.S. economy is performing well, a possible warning sign that losses could jump sharply if growth abates. (Bloomberg, August 2026)
Real Estate
Signs of Stabilization
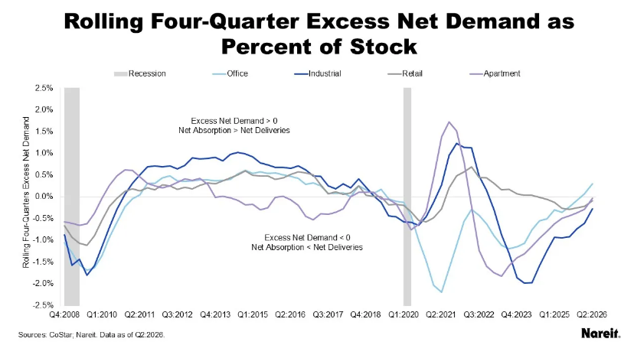
In the second quarter of 2026, CoStar data indicated that fundamentals across the four traditional property types continued to show positive momentum and signs of stabilization.
- Office has shown the largest improvement in supply/demand.
- After 26 consecutive quarters of negative excess net demand, office turned positive at the beginning of 2026 and improved further in Q2. It is now the only one of the four sectors where net absorption exceeds new deliveries. We believe that's encouraging, although office occupancy remains weak at just 86.1%, near its post-2008 low.
- Retail remains fundamentally the strongest.
- Occupancy is high at 95.6% and has been stable for several years. Supply and demand are also approximately balanced. Years of limited new construction have created favorable supply conditions.
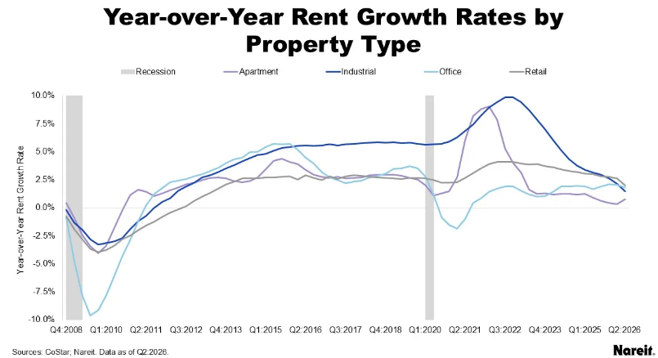
- Apartments are improving on supply/demand, but the near-term numbers remain weak. Deliveries and absorption are now approximately balanced, which is important because the huge wave of multifamily construction has been the primary headwind. But occupancy is only 91.9%, near its post-2008 low, and rent growth of just 0.8% is the weakest of the four sectors.
- Industrial is in between. Supply still exceeds demand, but the gap continues to narrow. Occupancy has stabilized around 92.5%, while rents are growing about 1.5% annually.
The most encouraging data point is excess net demand (net absorption minus new deliveries). All four major property sectors are moving upward, meaning the supply/demand imbalance created over the last several years is gradually correcting. (Nareit, August 2026 )
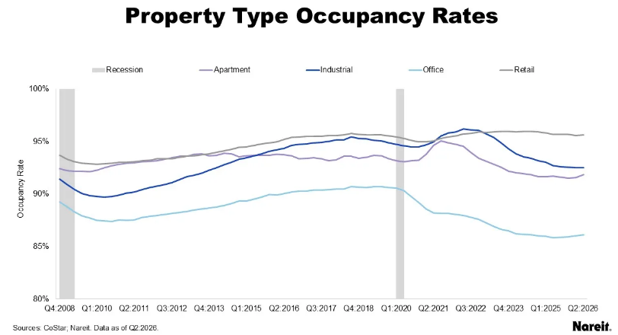
Despite better supply/demand, the improvement hasn't translated into strong NOI drivers yet. Occupancy is largely flat, and rent growth is below inflation across all four sectors
- Nareit describes the market as being around an inflection point rather than already experiencing a strong recovery.
Source: Improving Property Fundamentals Key to Strength of Future Operational Gains | Nareit
Economic Calendar: Week Ahead (Eastern Time)
Mon, 8/17 @ 8:30 am: Empire State Manufacturing Survey
@ 10:00 am: NAHB Housing Market Index
Tues, 8/18 @ 8:30 am: Housing Starts
@ 8:30 am: Import Prices
@ 9:15 am: Industrial Production, M/M%
@ 9:15 am: Capacity Utilization %
@ 10:00 am: Pending Home Sales Index, M/M%
Wed, 8/19 @ 2:00 pm: Federal Open Market Committee meeting minutes published
Thur, 8/20 @ 8:30 am: Weekly Jobless Claims
@ 8:30 am: Philadelphia Fed Business Outlook Survey
@ 10:00 am: Leading Indicators
Fri, 8/21 @ 9:45 am: US Flash Manufacturing PMI@ 9:45 am: US Flash Services
The Team Behind Friday Focus

Mary Ahn
Investment Research and Portfolio Strategy Manager

Cal Jones, CFA
Managing Director of Fixed Income

Eric Speron, CFA
Managing Director of Equities

Alton Tjahyono, CFA
Sr. Investment Strategist