
12 minute read
Economic stresses began to appear during the first quarter, capped by the second-largest bank failure in U.S. history (Silicon Valley Bank), as rising rates, tighter lending conditions and shrinking liquidity weighed on economic growth. Despite the turmoil, global equity markets held up remarkably well in March and posted solid returns for the quarter.
The S&P 500 Index was up 3.7% in March and gained 7.5% in the first quarter. Developed international stocks (MSCI EAFE Index) did a bit better, rising 8.5% for the quarter. Emerging markets stocks (MSCI EM Index) gained 4% for the quarter and rose 3% in March.
Underneath the market surface, there was wide dispersion in returns across sectors, market caps and styles. Large-cap growth stocks (Russell 1000 Growth Index) gained 14.4% in the quarter, while the large-cap value index returned 1%. The Nasdaq Composite surged 17%, while the Russell 2000 Small Cap Value Index dropped 0.7%. The technology and communications services sectors gained 21.8% and 20.5%, respectively, while financials and energy lost 5.6% and 4.7%, respectively.
Fixed-income markets had a strong quarter as longer-term bond yields fell, generating price gains. Core investment grade bonds (Bloomberg U.S. Aggregate Bond Index) returned 3%, as the 10-year Treasury yield fell to 3.5% from 3.9% at year-end. Riskier high yield bonds outperformed core bonds, gaining 3.7%. Municipal bonds gained 2.3% (Morningstar National Muni bond Category).
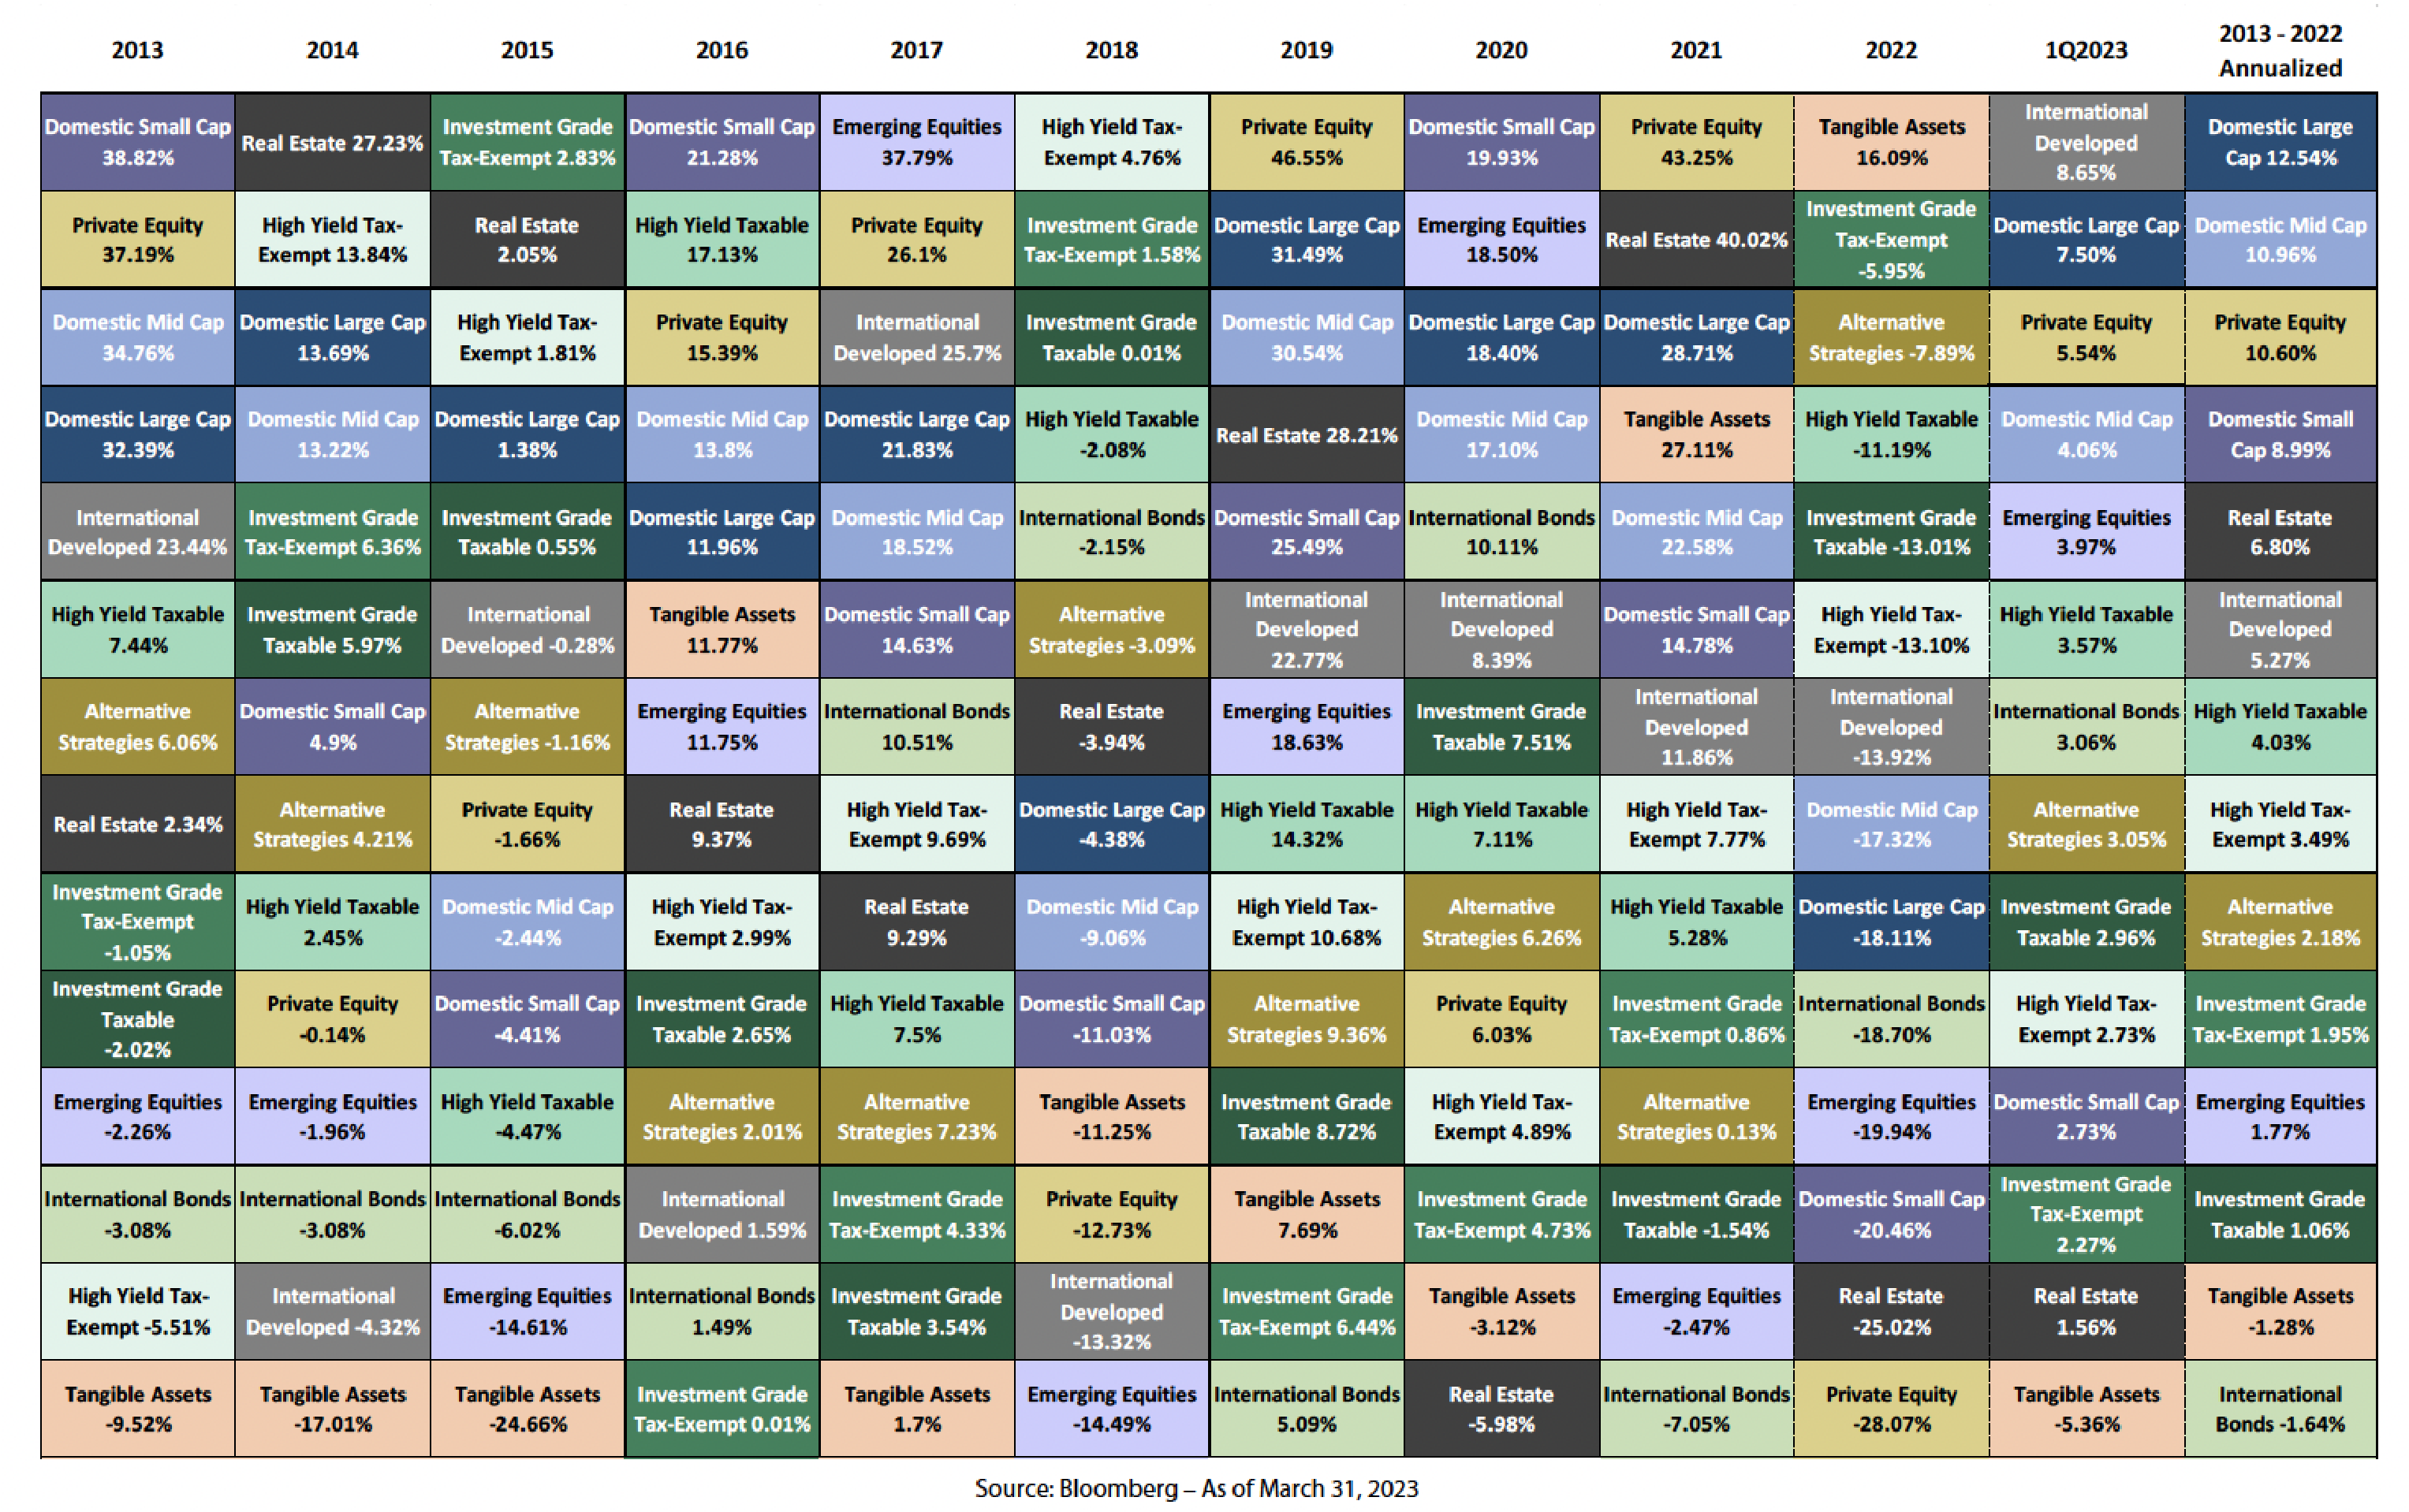
Alternative strategies generally underperformed traditional stock and bond indexes for the quarter. We continue to favor private real estate, private credit and equity, and infrastructure in our balanced portfolios.
Quick Recap: The Banking Crisis
The story of the Silicon Valley Bank (SVB) failure is well known. Still, we think a recap is worthwhile as it sets the stage for our broader discussion of the macroeconomic backdrop and outlook below.
In summary, SVB was a victim of a classic “bank run” where depositors seek to withdraw their money en masse but the bank doesn’t have the liquidity (the cash on hand) to meet their demand.
Importantly, SVB had unique characteristics that made it particularly susceptible to such a run. This is one reason we do not see this as the beginning of a replay of the Great Financial Crisis (GFC) of 2008. But there clearly will be broader economic and financial market impacts, which we will discuss later in this commentary.
While SVB’s situation was unique, the seeds of the bank run, and the broader banking system stress now playing out, were planted with the Federal Reserve’s unprecedented monetary policy stimulus (quantitative easing and zero interest rates) in the years following the GFC and then turbocharged by the pandemic stimulus. The damage has come from the Fed embarking on its most aggressive monetary policy tightening in 50 years – hiking interest rates from 0% to 4.75% over the past 12 months.
As all bond investors painfully experienced last year, sharply rising interest rates caused sharp declines in core bond prices (the worst declines in U.S. bond market history). This includes Treasury bonds and government agency mortgage-backed securities (MBS) – where many banks invested some of their customers’ deposits.
All banks’ bond holdings have been hurt by the sharp rise in rates and falling bond prices, but SVB was particularly exposed to this interest-rate risk. SVB held an unusually large share of its assets in bonds, and those bonds had particularly long duration – meaning their prices were highly sensitive to changes in interest rates. For that reason, SVB faced extremely large unrealized losses on its bond portfolio, which the bank had purchased when interest rates were much lower and prices were much higher.
But that’s not all. In addition to SVB’s huge exposure to unrealized losses in its bond holdings, it had two other unique characteristics to a bank run: (1) it had a highly concentrated depositor base composed of start-up tech, venture capital firms, and the like; and (2) almost its entire depositor base was above the Federal Deposit Insurance Corporation (FDIC) insurance coverage limit of $250,000 per account – 90% of SVB’s total deposit base was FDIC uninsured at year-end 2022. Note that Signature Bank, the other regional bank taken over by the FDIC, also had roughly 90% uninsured deposits.
Combined, these characteristics of SVB caused some of its concentrated, large, uninsured depositors to start pulling their money from the bank, which in turn forced SVB to raise capital (liquidity) to meet the withdrawals, which meant SVB had to sell bonds at losses (and/or raise equity capital). This turned the unrealized losses on its balance sheet into realized losses, raising the question of not only liquidity risk for the bank but also solvency/bankruptcy risk, leading to even more depositor flight, until the FDIC and the Fed stepped in over the weekend of March 11 to take over the bank and guarantee all the SVB deposits above $250,000, and set up a broad banking liquidity backstop (the Bank Term Funding Program (BTFP)).
The BTFP program helps enable banks to meet deposit withdrawals and other liquidity needs without having to sell currently underwater bonds at a loss. While the banking system is not out of the woods, it seems these steps have stemmed the risk of widespread bank-run contagion. We don’t believe this is the beginning of GFC 2.0. There are key differences between then and now:
- The GFC was the result of a self-reinforcing negative spiral involving credit risk and counterparty risk. Banks and other financial institutions lent hugely to unqualified borrowers, and the systemic risk was multiplied by the creation of financial derivatives based on shoddy loans.
- As housing prices fell, the value of these loans collapsed, and banks had insufficient capital to handle the declines. This led to a credit crunch, which further fed the housing price decline and economic downturn, leading to further losses on loan values and further bank insolvency.
This time, the problem was caused not by poor lending standards (credit risk) and weak balance sheets but instead by interest rate duration risk from the Treasury and agency bond holdings, and the other factors that were previously mentioned, whose values plunged as interest rates soared. There is no risk of default – no credit risk – in Treasuries and government agency MBS.
Further, in the current situation, as core bond yields have subsequently fallen in response to risk aversion and macro fears caused by the SVB crisis, the value of banks’ high-quality bond holdings has increased (unrealized losses have lessened). So this seems more of a self-limiting feedback loop, which is very different from the self-perpetuating adverse feedback loop of the GFC.
U.S. consumers are now less leveraged, and lending standards were tightened in the housing market. Banks are better capitalized now, particularly the largest “systemically important” banks, due to tighter regulations. Having lived through 2008, the Fed, FDIC and Treasury have acted quickly and forcefully to stem the systemic contagion risk.
Macro Outlook: Inflation and Growth
U.S. inflation remains too high, based on the Fed’s most recent comment, but is likely to continue to decline significantly over the year. Although inflation peaked last year, it remains too high for the Fed’s 2% long-term target. Let’s look at the data. The Consumer Price Index, which measures a basket of items most frequently purchased by consumers – homes, food, energy, apparel, etc. – has been declining for the past three months. While inflation rose 5% on a year-over-year basis, consumer prices over the past six months have been advancing at a 2% annualized rate – right at the Fed’s stated target. Core consumer prices have also sharply and rapidly descended from their mid-2022 peak. The Fed’s preferred measure of inflation – the personal consumption expenditure (core PCE) – has also slowed to about a 4% rate, still above the Fed’s target but down sharply from its post-pandemic high. All measures of inflation have followed the same trajectory since June 2022, and finally some components like shelter have started to decline.
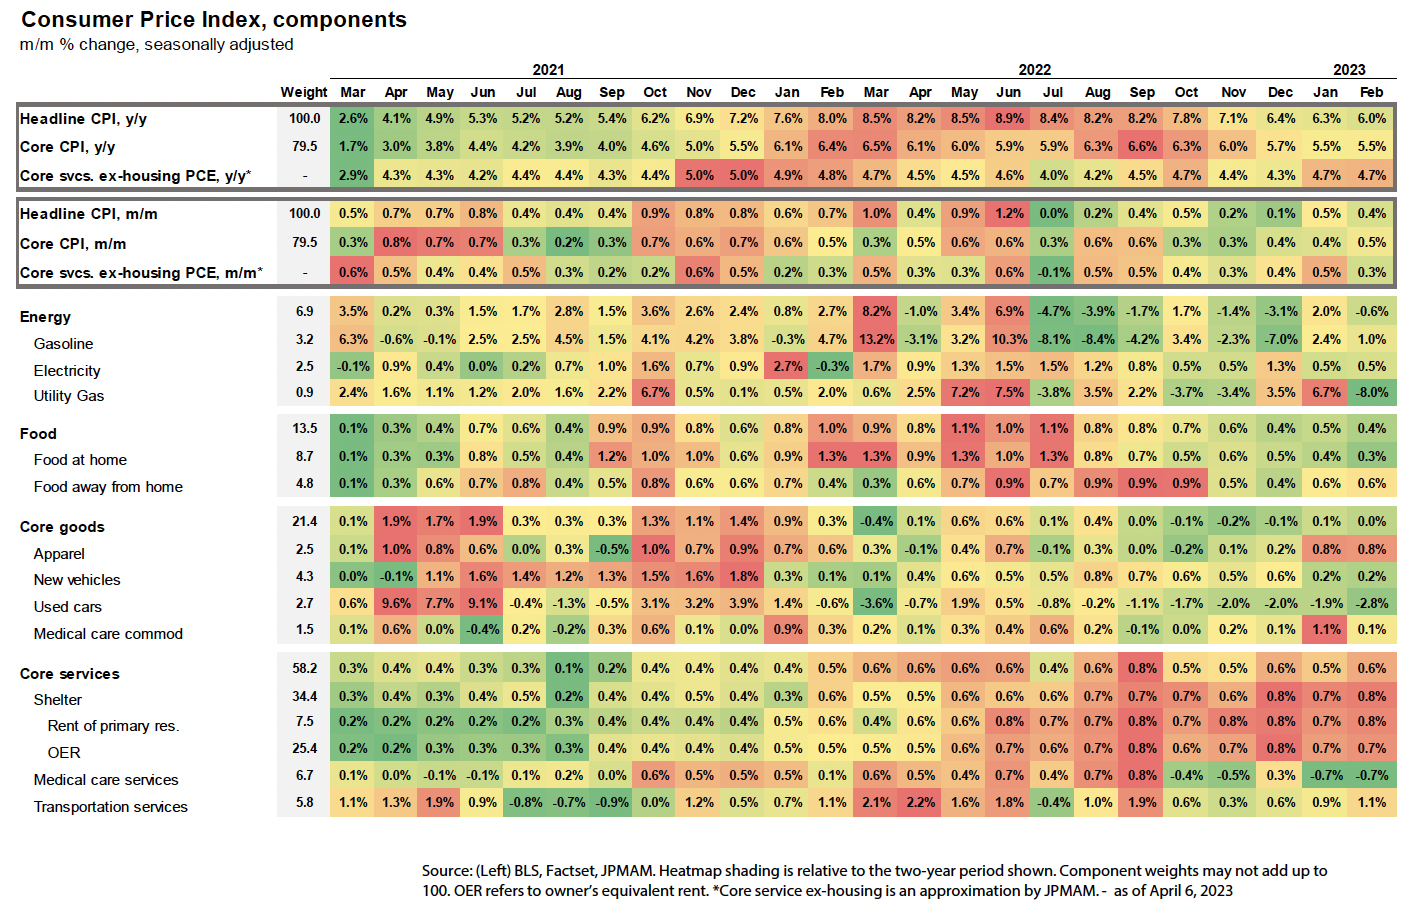
The largest component of the core services inflation is shelter, which includes housing rental prices. Given the slowdown in the housing market over the past year as well as real-time measures of rent declines, most economists expect shelter inflation to decline more rapidly over the rest of 2023.
The Fed
At its March 22 Federal Open Market Committee (FOMC) meeting, the Fed hiked its federal funds policy rate by 25 basis points (bps) to a range of 4.75% to 5%. This was the consensus expectation, although a number of market participants thought the Fed might not hike at all given the upheaval in the banking sector. But the Fed’s inflation concerns won out over worries about exacerbating the banking stress. This was the Fed’s ninth consecutive hike since March 2022, representing a total tightening of 475 bps. This is the most aggressive monetary policy tightening campaign since the Paul Volcker days in the early 1980s. It was inevitable something (in this case, SVB) would break given the magnitude and speed of the hikes.
The Fed is still hoping it can land the economy softly without causing much damage, let alone a recession. It’s not impossible, but the odds are low, and history is not on the Fed’s side given the complexity of the task and the multitude of economic and behavioral variables outside its control.
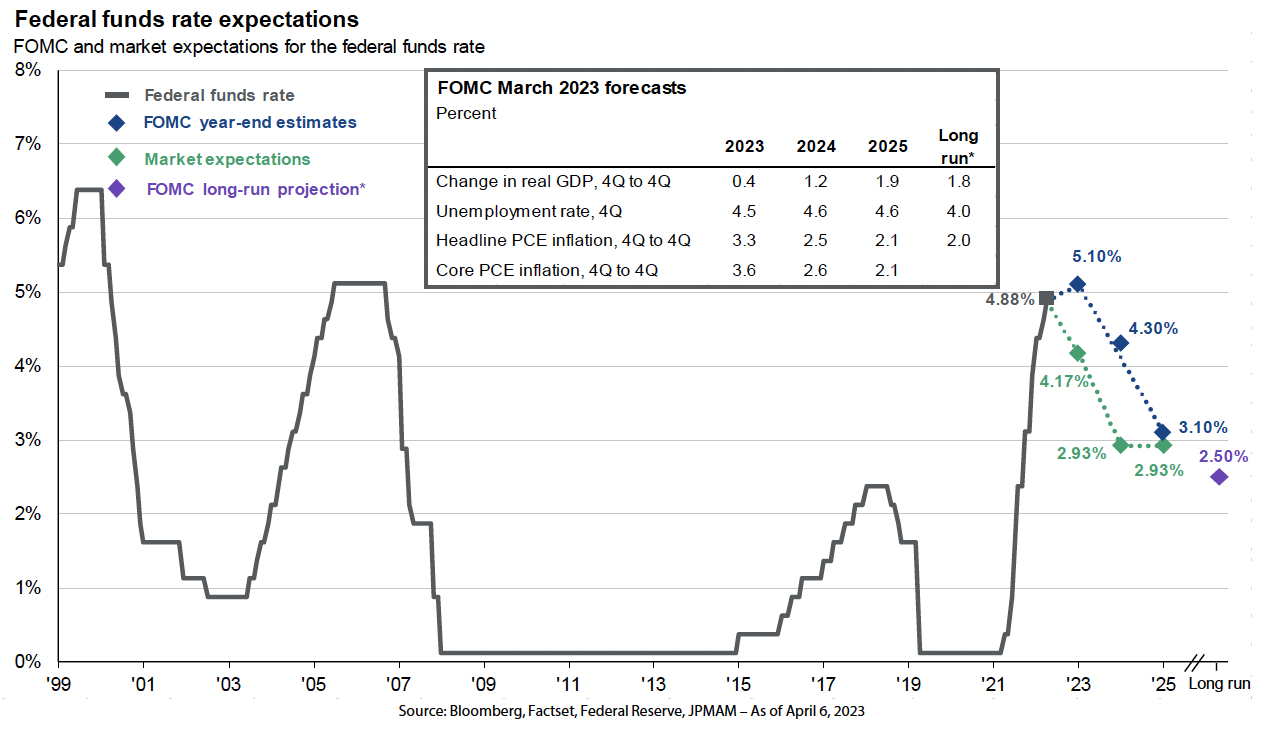
As of the March meeting, the median FOMC participant projects just one more 25-bps rate hike this year, to a range of 5% to 5.25% and then 75 bps of rate cuts in 2024. The median FOMC participant projects core PCE inflation falling to 3.6% this year and 2.6% by the end of 2024. If the Fed projections play out, that implies a real fed funds rate of 1.5%, which the Fed would consider restrictive/tight. The Fed’s assumption for the long-run neutral real fed funds rate (fed funds rate after inflation) is 0.5%, comprising 2% core inflation and a 2.5% nominal fed funds rate.
At his March press conference, Chair Jerome Powell reiterated that he and his Fed colleagues do not expect to cut rates this year. However, the fed funds futures market doesn’t believe him; it is currently pricing in roughly 75 to 100 bps of rate cuts this year. It seems the futures market is implicitly assuming an economic slowdown, recession or crisis that forces the Fed to sharply ease. One thing is certain; the fed funds futures and the Fed projections can’t both be right on this.
Referring to the banking stress, the March FOMC statement said, “Recent developments are likely to result in tighter credit conditions for households and businesses and to weigh on economic activity, hiring and inflation. The extent of these effects is uncertain. We know now that lending has fallen off a cliff with the March lending data being the worst in history.” Powell also remarked that the likely tightening in credit conditions, in a way, substitutes for rate hikes. Some think that the decline in lending as a result of the banking crisis is the equivalent of an additional 100 bps in rate hikes. The Fed is trying to thread the needle in balancing the threats associated with the banking crisis and the need to combat inflation. We think the Fed is at the end of its rate hike cycle and inflation will trend down to the Fed target range by the end of the year.
Economic Growth
With the Fed sharply tightening, the short-term outlook for economic growth was already poor coming into the year. Add to that the negative impact from tighter credit conditions due to the recent banking stress, and the growth outlook has gotten worse. How much worse isn’t clear. But it definitely hasn’t improved the chance of avoiding a recession.
The FOMC’s updated economic projections from March showed a further reduction in its gross domestic product (GDP) growth expectations for 2023, to just 0.4%. Given the first quarter’s likely GDP growth, this implies negative GDP for the rest of the year.
The FOMC left its unemployment rate forecast roughly unchanged at 4.5% for this year. If that occurs, history strongly suggests a recession is likely; since 1950, there has never been an instance where the U.S. unemployment rate increased by one-half percentage point or more from its cyclical low without an accompanying recession. The unemployment rate bottomed out at 3.4% in January 2023 and 3.6% in February.
On the positive side, the U.S. and other major global economies appear to have growth in the first quarter of the year. The Purchasing Managers Index (PMI) improved in February and March, indicating the U.S., Europe, Japan and China are all currently in expansionary territory (PMI above 50). The economic surprise indexes for these regions are also in strongly positive territory, indicating recent economic data points in aggregate have been much better than expected. Household and business balance sheets remain healthy and supportive of continued spending.
Putting all the macro pieces together, our view remains the same. We see a mild U.S. recession as the most likely scenario over the next 12 months. Our best guess at this point is that if the U.S. economy does fall into a recession, it is likely to be much milder than the 2007-08 and 2000-01 recessions. Our confidence on the severity of a recession is not sufficiently high. So as a result, we have not made a further move to reduce our stock exposure based on a severe recession bet. We have, however, increased our allocation to longer U.S. Treasuries and municipal bonds.
Financial Markets Outlook and Portfolio Positioning
We face plenty of issues today, but rather than assume a severe recession will play out, we expect this to be a more typical cyclical recession. Our portfolios are built on the foundation of a long-term strategic asset that aligns with our clients’ risk profile, financial objectives and investment temperament. As such, our portfolios are structured to be resilient across a wide range of scenarios but also have the flexibility to be opportunistic when the markets get out of whack. In such cases, we act contrary to the current market mood – trying to be greedy when others are fearful.
Valuations look fair for U.S. equities. We are slightly overweighted to large cap equities that should benefit from a declining dollar, and these companies have better balance sheets for weathering the storm of a recession. As we pointed out last year, our base case five-year expected return range for the S&P 500 is 7%-10% annualized.
Developed International and Emerging Markets
Our base case five-year returns for EM and developed international stocks are in the low double digits, supported by low starting valuations and depressed earnings. Things don’t have to become great for international and EM stocks to generate strong returns from here – they just need to get better from depressed levels.
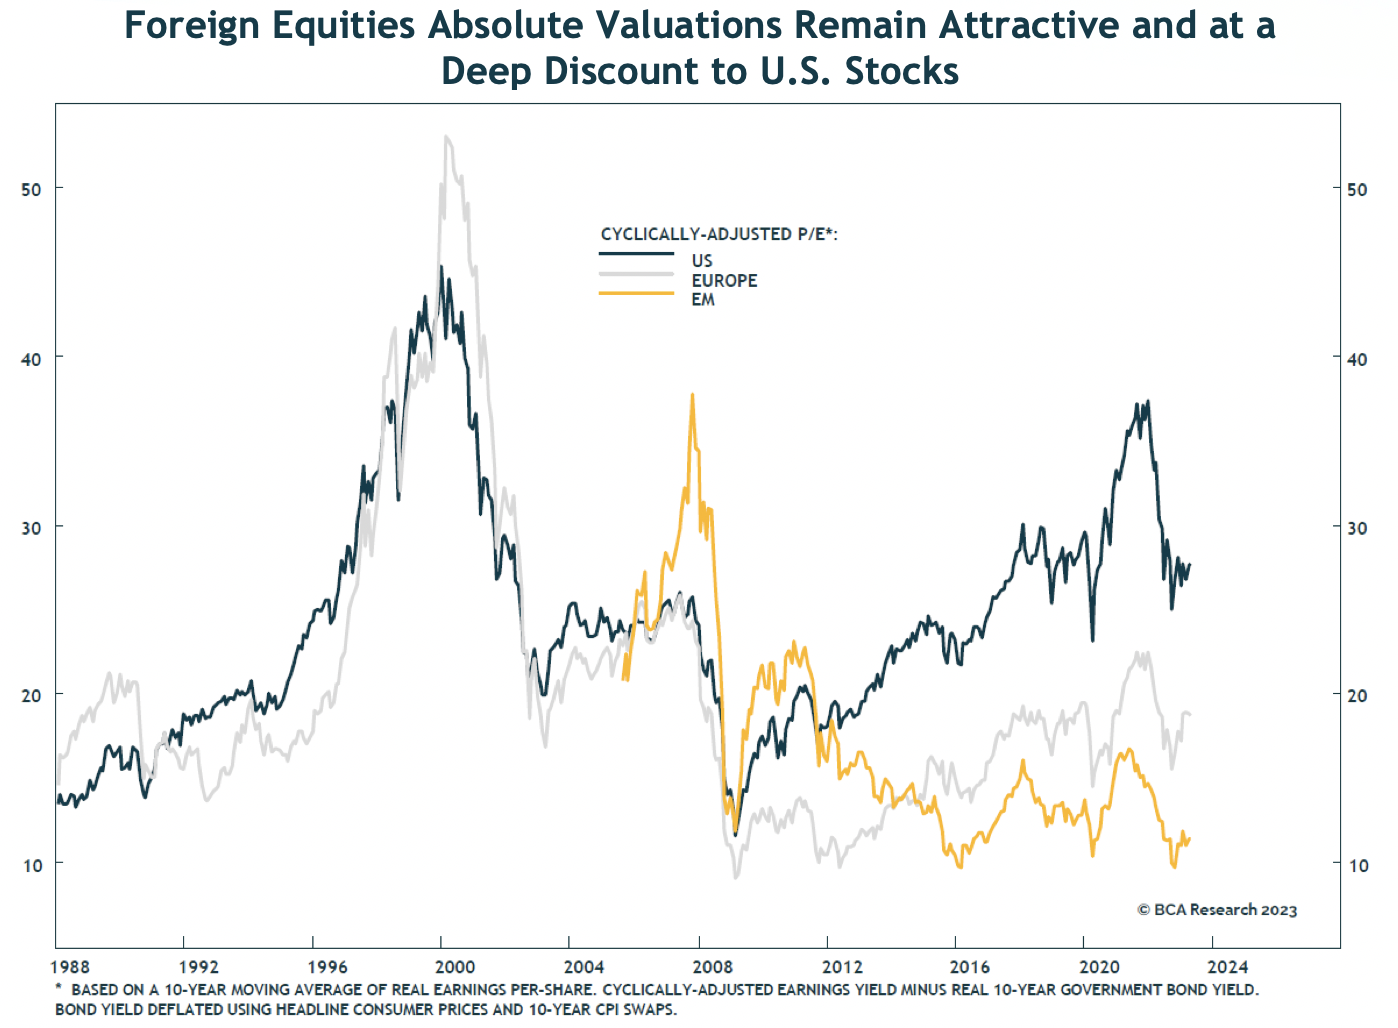
The U.S. dollar should be an additional tailwind for foreign stocks. When the dollar depreciates versus EM currencies, EM stocks typically do very well. The dollar has declined in the past two quarters, which has boosted returns overseas. We think this trend will continue for 2023, which will add upside to foreign stock returns.
Fixed Income
One of our key changes last year was our significant increase in core bonds as a result of the rise in interest rates, which made bonds much more attractive from a risk and return perspective than they had been in years. With the recent rise in Treasury and municipal bond yields to levels not seen since 2018 (and prior to that, 2009), we have significantly increased our core fixed income by purchasing high-quality municipal bonds and Treasury bonds while reducing our credit risk. Our credit strategies performed well during rising interest rates, and we have now tactically shifted those positions into high-quality core fixed income. With the current yield, core bonds now offer better downside protection and shorter-term return potential in many different economic scenarios.
Alternative Strategies
Our alternative strategies were the bright spot in our globally diversified portfolios in 2022. Alternatives provide powerful long-term portfolio benefits and non-correlated returns compared to traditional stock and bond holdings and improve the risk-adjusted returns of balanced portfolios. There never being any guarantee as to future points, given the current macro risks and market backdrop, we think they are especially valuable.
We favor private real estate investment allocations to multifamily, industrial and self-storage, and selected grocery-anchored centers. We expect equity-like long-term returns from these investments with built-in inflation protection and tax-efficient income generation. We also favor private equity and credit opportunities.
Closing Thoughts
There’s an old saying about the Federal Reserve tightening cycles: The Fed “tightens until something breaks.” Cracks emerged during the quarter as rising rates, tightening lending conditions and shrinking liquidity weighed on economic growth. The banking system turmoil was an unsettling addition to investor concerns. We think the Fed is at the end of its tightening cycle and inflation will continue to moderate.
We expect more volatility as an economic slowdown or recession will likely lead to slowing corporate earnings. While it can be challenging, it is critical for long-term investors to stay the course through these rough periods in the markets. The shorter-term turbulence and discomfort is the price one pays to earn the long-term equity risk premium that most investors need to build long-term wealth and achieve their financial objectives.
Outside the U.S. stock market, we already see attractive medium-term expected returns from international and emerging stocks. A declining dollar, as we expect, would further fuel non-U.S. equity returns.
Fixed-income assets and high-quality bonds are also now attractively priced with mixed single-digit or better expected returns. Core bonds will also provide downside stability in the event of a recession. Our investments in alternative strategies should provide further resilience to our portfolio.
We sincerely thank you for your confidence and trust. Please do not hesitate to reach out to us if you have any questions or concerns.