

5 minute read
Smart insight and clear visuals that matter – what we’re watching now and how intention and conviction shape our portfolios.
Markets
The Momentum Trade
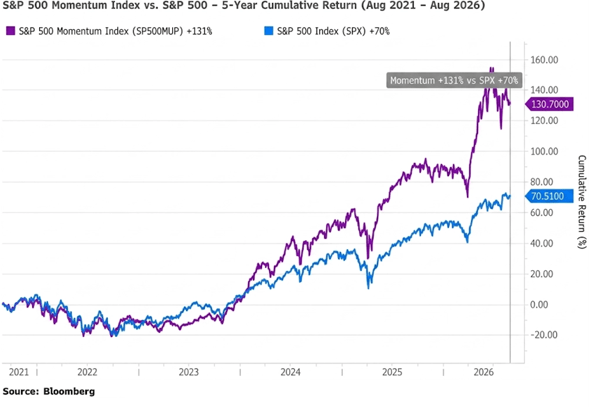
For years, it paid off to buy stocks that were rising in price and bet against struggling shares. This momentum trade went into overdrive earlier this year as investors aggressively chased AI darlings like Nvidia, AMD, and Micron, while dumping anything perceived as collateral damage. The S&P 500 Momentum Index posted a record 44% gain in the second quarter, pushing its five-year return to 133%—roughly double the performance of the broader market.
Since July 1, the momentum index has tumbled more than 9%, severely lagging the S&P 500's resilient 2.8% gain. The scale of this reversal is historic, with the strategy currently on track for its worst quarterly underperformance in 25 years. According to Bank of America, July was the second-worst month for the momentum trade in four decades, eclipsed only by the violent market rotation of April 2009.
Now, sentiment has flipped entirely. Traders are actively shorting the very tech giants that fueled the first-half rally. Commodity Futures Trading Commission (CFTC) data shows that speculative net short positions in Nasdaq-100 futures recently spiked to their highest levels in two decades, signaling a dramatic and painful unwinding of the market's most crowded trade.
Tech
The Economics of Scarcity in the AI Era
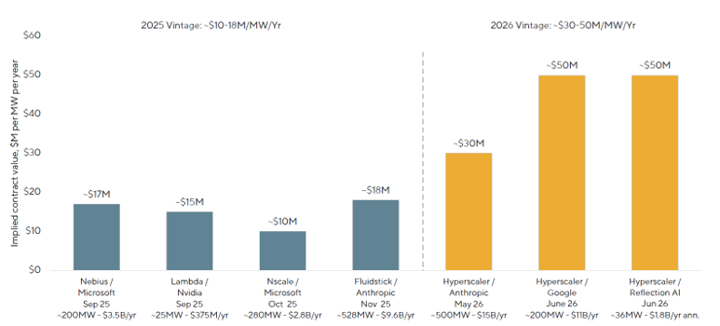
In June, Apollo wrote an article on how they believe compute is becoming a competitive moat (for the near term at least).
- Companies with secured capacity can serve demand today; those without it could face rationing, slower deployment, or significantly higher costs.
- Companies with the ability to pay for compute may gain an advantage, while smaller firms and experimental use cases could face increasing barriers to access.
- Several developments could ultimately ease the compute shortage narrative: A sharper-than-expected improvement in model efficiency, a cyclical slowdown in AI demand, a faster ramp in semiconductor and power infrastructure capacity, or breakthroughs that reduce dependence on today’s constrained hardware stack.
- Here are some charts from GQG showing the material change in pricing for AI Compute from 2025 to 2026.
Source: GQG Partners LLC (chart). RBC Capital Markets (data). Data as of 6 July 2026. MW represents megawatt or one million watts of electrical power.
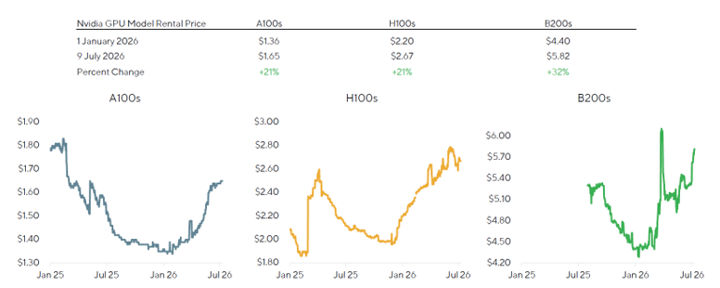
Source: GQG Partners LLC (chart). Bloomberg LP (data). Data as of 9 July 2026. NVIDIA A100 is a data center GPU built on the Ampere architecture, powering AI, data analytics, and high-performance computing (HPC). The NVIDIA H100 is an enterprise data center GPU based on the Hopper architecture, purpose-built for massive AI training, Large Language Models (LLMs), and high-performance computing (HPC). The NVIDIA B200 is a data center GPU built on the Blackwell architecture and includes 208 billion transistors in a dual-die design.
Housing
Higher Rates Continue to Weigh on Housing Activity
- Freddie Mac reported that the average rate on the popular 30-year fixed mortgage rose to 6.66%, its highest level in a year and up roughly 70 basis points since the conflict with Iran began.
- The U.S. government reported last week that construction spending unexpectedly declined in July, falling to its lowest level in nearly three years as higher mortgage rates continued to weigh on single-family homebuilding. According to the Commerce Department's Census Bureau, construction spending fell 0.5% to $2.158 trillion, the lowest level since October 2023.
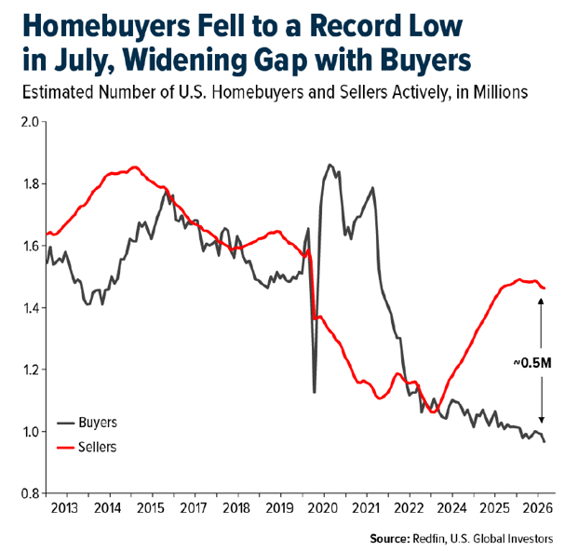
- Redfin reported that homebuyer activity fell to a record low in July, widening the gap between buyers and sellers and adding further pressure to the housing market outlook.
- Lumber prices have fallen to their lowest level of the year and are approaching bear market territory after declining 17% from July's peak.
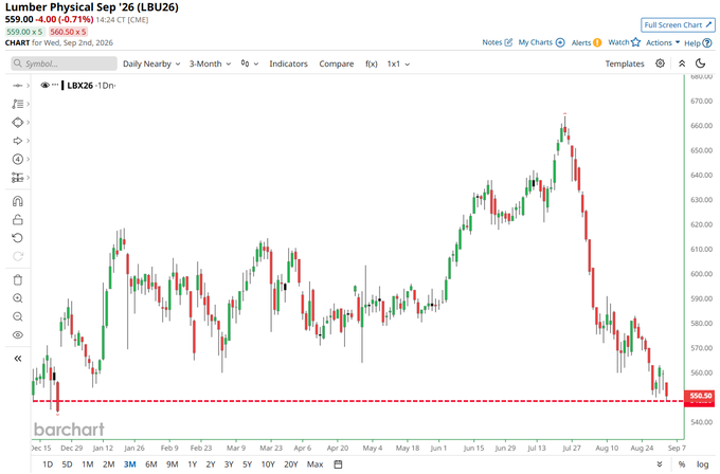
Source: Bloomberg
Economic Calendar: Week Ahead (Eastern Time)
Tues, 9/8 @ 6:00 am: NFIB Index of Small Business
@ 3:00 pm: Consumer Credit
Thur, 9/10 @ 8:30 am: Weekly Jobless Claims
@ 8:30 am: Producer Price Index, Y/Y%
@ 8:30 am: Ex-Food & Energy PPI, M/M%
@ 10:00 am: Monthly Wholesale Trade
@ 10:00 am: Existing Home Sales
Fri, 9/11 @ 8:30 am: Consumer Price Index, Y/Y%
@ 8:30 am: Core CPI M/M%
@ 10:00 am: U. Michigan Prelim Consumer Survey
@ 2:00 pm: Monthly Treasury Balance
The Team Behind Friday Focus

Mary Ahn
Investment Research and Portfolio Strategy Manager

Cal Jones, CFA
Managing Director of Fixed Income

Eric Speron, CFA
Managing Director of Equities

Alton Tjahyono, CFA
Sr. Investment Strategist