
8 minute read
Smart insight and clear visuals that matter – what we’re watching now and how intention and conviction shape our portfolios.
Markets
The most important development over the past couple weeks has been the pickup in Treasury bond market volatility. The US 10yr Treasury has broken out, reaching a peak of 4.44%, as bond investors have focused anew on Iran-driven stagflation risks. Any move in the 10yr yield beyond the 4.5% level could be negative for equities, as well as causing investors to refocus on America’s fiscal issues.
Basic Logic:
- Longer war = Higher-for-longer energy prices = Bigger inflation shock = Less scope for rate cuts and more risk of rate hikes.
- As governments move to cushion energy costs = Bigger deficits
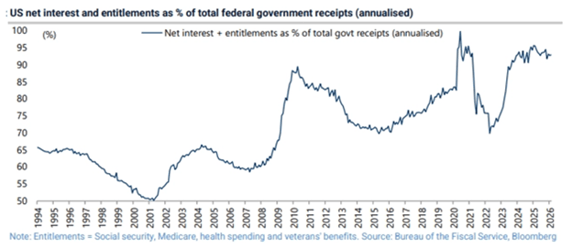
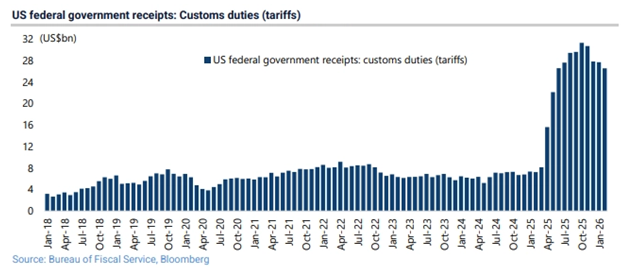
Net interest payments and entitlements are running at 92.8% of total federal government receipts, despite tariff revenues which have now presumably dried up because of the Supreme Court decision in February. It has become increasingly clear that bond markets could dictate just how long President Trump can continue to increase pressure in the Iran war. The US economy may not be conditioned to handle a 5% 10yr yield.
Energy
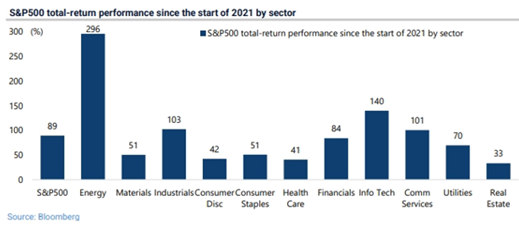
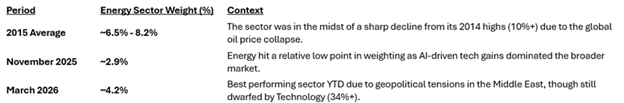
With oil prices in the high $90s and markets reflecting concerns of a more protracted disruption, it is interesting to note that Energy is now by far the best performing sector in the US since the start of 2021. The S&P500 Energy sector index has risen by 296% on a total-return basis since the start of 2021, compared with an 89% gain in the S&P500 and a 140% gain in the S&P500 Info Tech sector index. The energy sector is also the best performing sector year-to-date, rising by 36.3% on a total-return basis. This compares with a 3.4% decline in the S&P 500 and a 7.1% decline in the IT sector index. The following table highlights the dramatic shift in the Energy sector's influence over the past decade:
Asset Classes
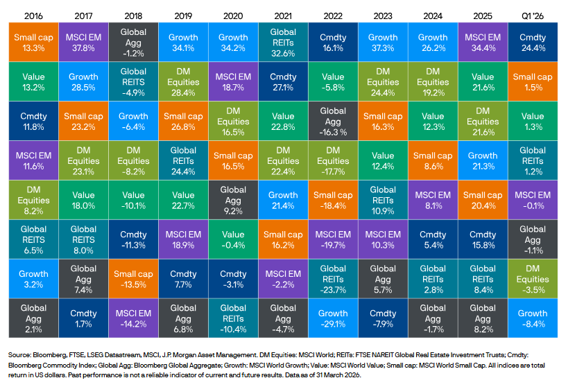
Commodities stood out as the best-performing asset class in Q1 2026 despite wide dispersion. Energy gained as oil prices surged nearly 75% while precious metals lost steam. Within equities, valuations corrected across the board, but U.S. large cap struggled, dragged lower by the Mag 7 (-15%) as concerns grew over the payback from the ever-increasing AI capex. Small cap fared better, as investors continue to expect a sharp acceleration in earnings growth. Internationally, emerging markets continued to outperform developed market peers, led by markets such as Korea and Taiwan that are benefiting from AI related capex. In fixed income, yields rose roughly 35bps since the start of the year, weighing on returns as near-term inflation concerns again came to the fore front.
Asset Class and Style Returns
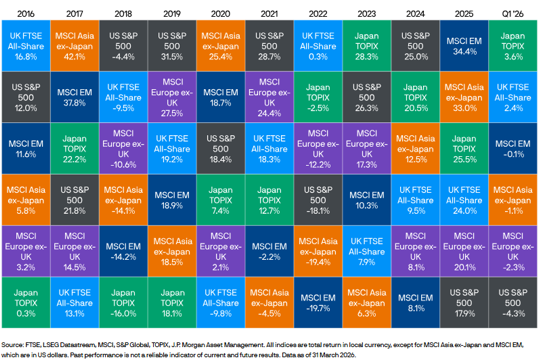
World Stock Market Returns
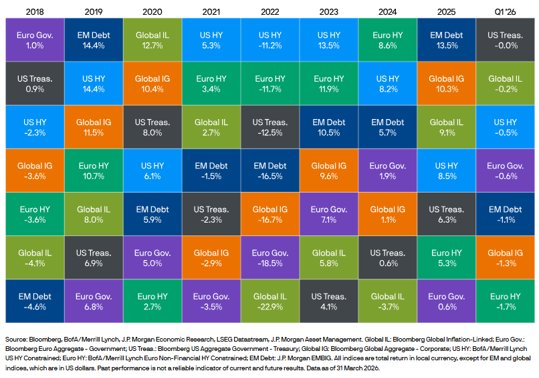
Fixed Income Sector Returns
Private Credit
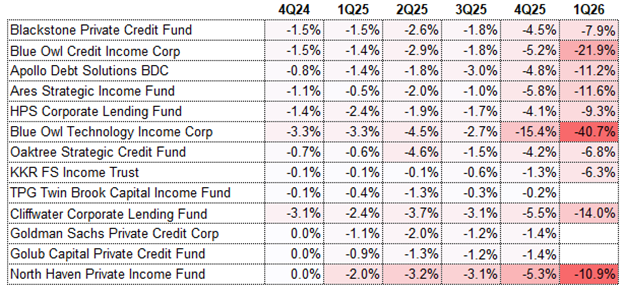
Blue Owl revealed higher-than-usual redemption requests across its private credit funds. The firm’s flagship OCIC fund received redemption requests of a 21.9% of shares outstanding during the first quarter. Blue Owl’s smaller, tech-oriented fund, OTIC, received redemption requests of 40.7% during the same period. On top of the lower relative risk return profile, you are really facing a prison’s dilemma type environment where the best option may be to redeem.
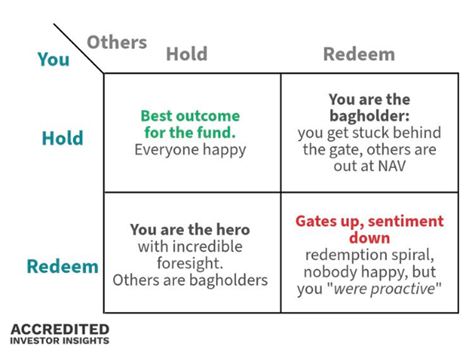
Blue Owl investors asked for an average 30% of their money back yesterday between two funds. But if you are struggling to keep up with all the gates going up, here is a list of some of the most high-profile investment companies that have held back investor money.
Tech
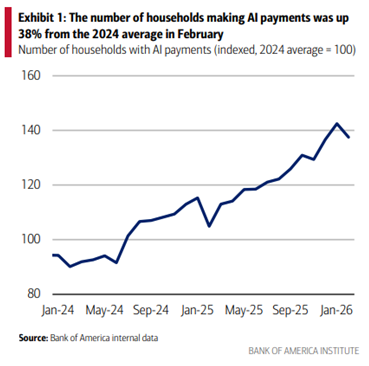
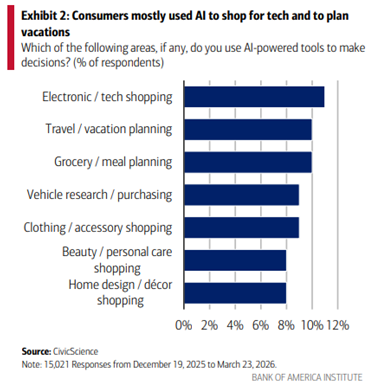
We have long argued that the primary beneficiary of AI will be the consumer. Consumers are already paying for it, while the range of use-cases multiply. The key question for the stock market is whether those use-cases can be enough to justify the capex. For now, the answer is likely no, but the bet is that enterprises can start charging for it while those use-cases expand.
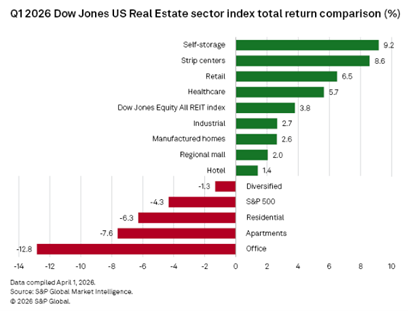
REITs
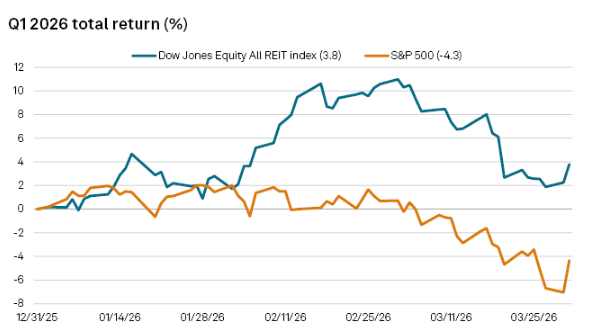
U.S. equity real estate investment trust stocks outperformed the broader stock market during the first quarter. Self-storage REIT index logged the largest return for the first quarter, at 9.2%, followed closely by the strip centers REIT index with an 8.6% return. The office REIT index again recorded the largest decline for the quarter, with a return of negative 12.8%.
Economic Calendar: Week Ahead (Eastern Time)
Tues, 4/7 @ 8:30 am: Durable-goods orders
Wed, 4/8 @ 2:00 pm: Minutes of Fed’s May FOMC meeting
Thur, 4/9 @ 8:30 am: Initial Jobless Claims
@ 8:30 am: Personal Income/ Spending
@ 8:30 am: PCE Index/ PCE Index YoY
@ 8:30 am: Core PCE Index/ Core PCE Index YoY
@ 8:30 am: GDP (second revision)
Fri, 4/3 @ 830 am: Consumer Price Index
@ 830 am: Core CPI/ Core CPI YoY
@ 10am: Factory Orders
The Team Behind Friday Focus

Mary Ahn
Investment Research and Portfolio Strategy Manager

Cal Jones, CFA
Managing Director of Fixed Income

Eric Speron, CFA
Managing Director of Equities

Alton Tjahyono, CFA
Sr. Investment Strategist