
5 minute read
Smart insight and clear visuals that matter – what we’re watching now and how intention and conviction shape our portfolios.
Markets
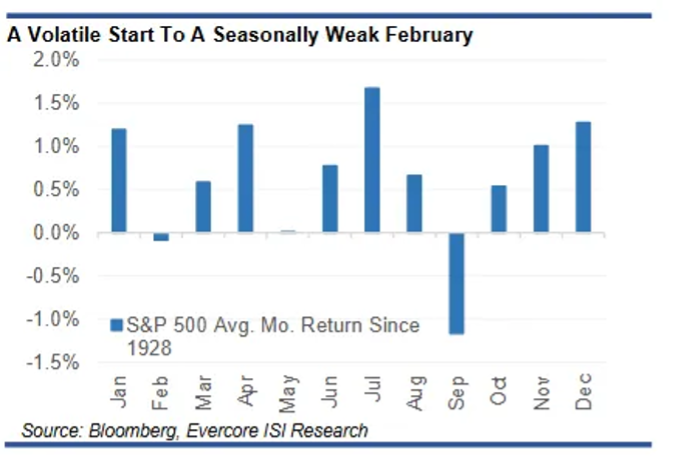
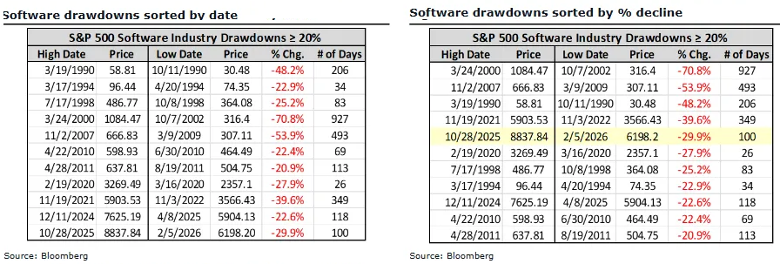
After a strong January (up 1.4%), the S&P 500 has run into the typical February seasonal headwinds where the “New Year” momentum fades and earnings season fatigue sets in. AI developments ranging from Moltbook (social network exclusive for AI agents) to Anthropic’s new legal AI tool have raised the alarm of severe disruption in Software and broader Tech. The past three month returns for the S&P 500 Software sub-sector vs. the S&P 500 have been rivaled only by the Dot.Com bust (down 29.9% over 100 days is the 5th worst on record since 1990).
Stormy and Calm Seas?
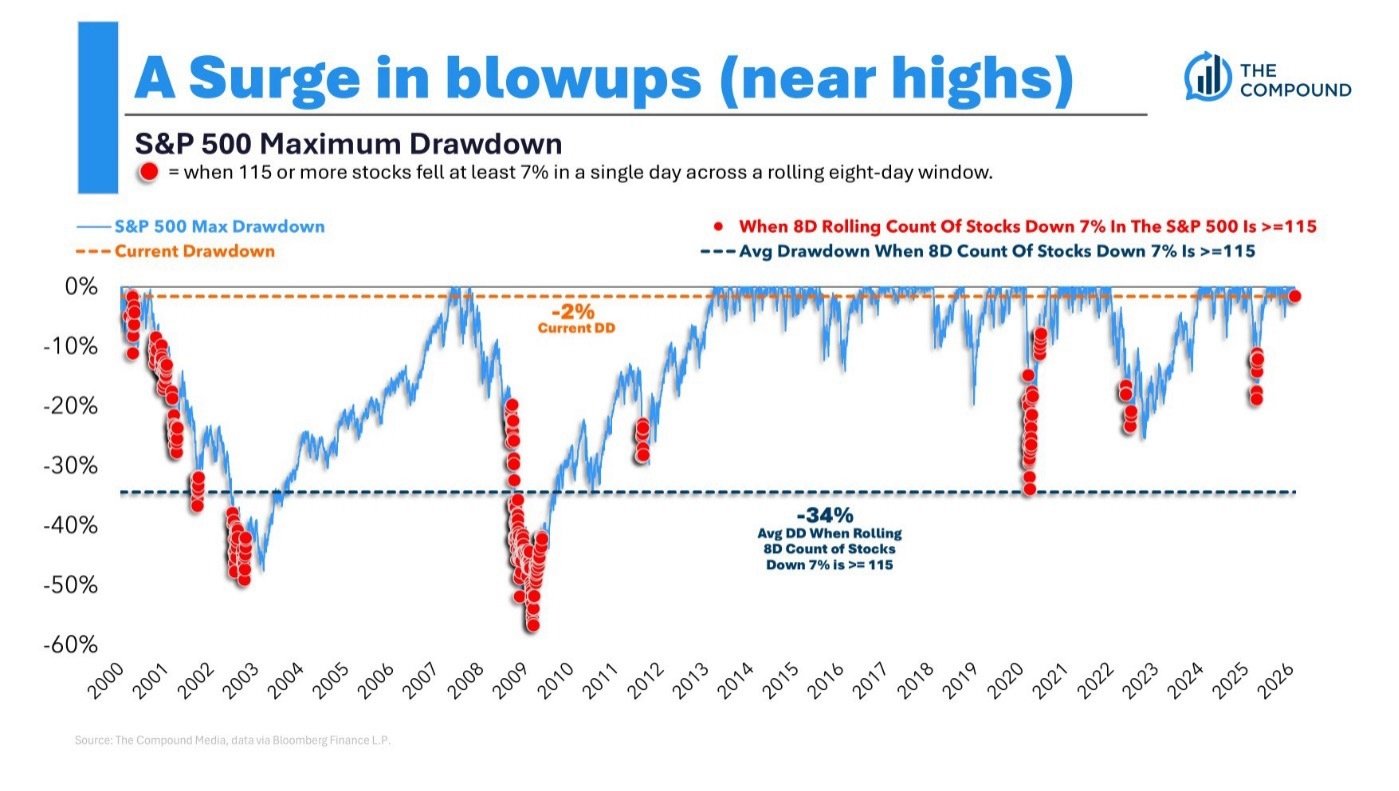
There have been some high-profile blow ups in 2026 as you can see in the graph below. What we do not know is, will this be contained like the Telecom Bubble of 2001 and the Euro Crisis of 2011 or is it the start of another Great Recession? The market has an answer, at least at this point. These blow-ups seem to be contained to just one category of stocks, information services, which isn’t relegated to one S&P sector but is an AI-vulnerable business model that surfaces in a few different market sectors.
What’s the evidence? While it is true we have seen a surge in blowups, the S&P 500 is within 2% of its all time high! Historically, when 115 or more stocks in the index drop by at least 7% over an eight-day period (marked by red dots), the average maximum drawdown for the S&P 500 has been -34%. We haven’t seen anything like that but why? While AI seems deflationary for the digital world and its businesses, AI looks inflationary for the physical world and its businesses, diversification again being your ally here. As we said last year, is the bear market in diversification over?
Whatever it is, Market Volume is through the Roof
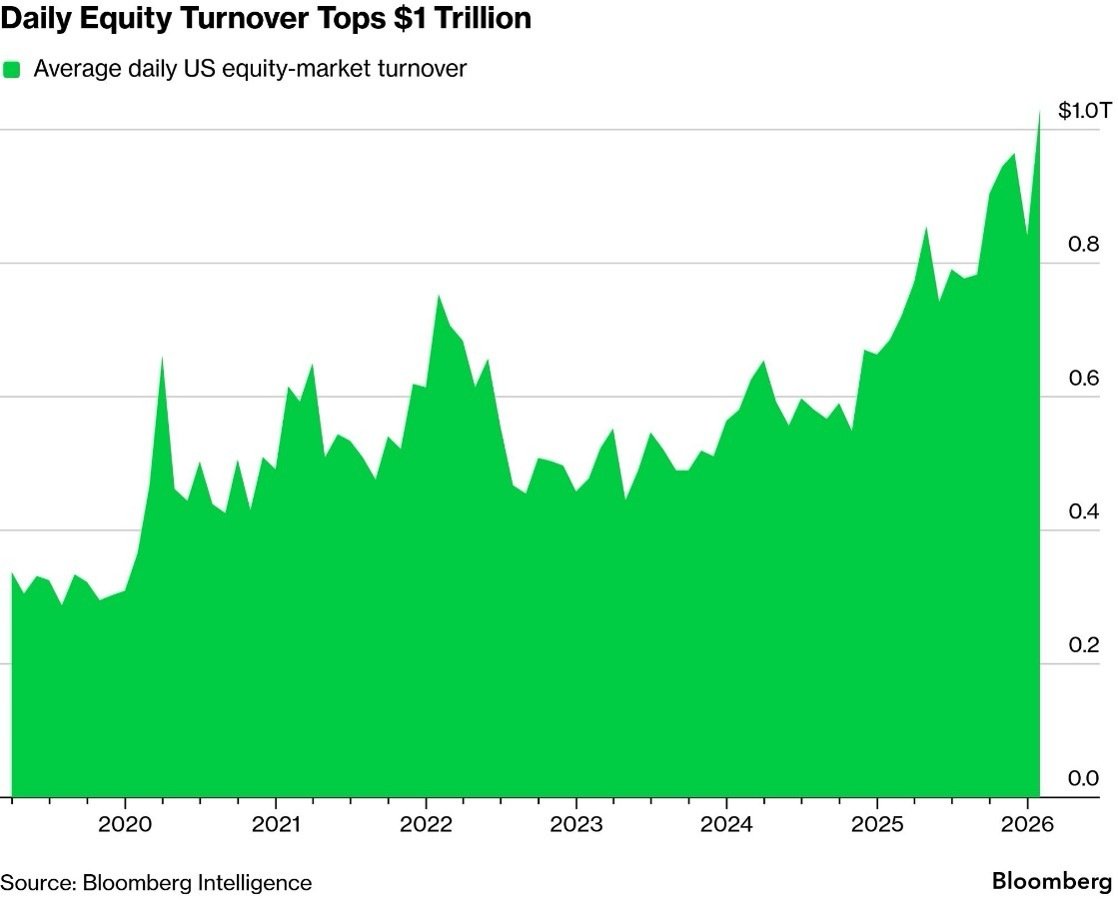
This has been a boon for exchanges as US equity markets are moving more money than ever before. Blowing past $1 trillion in shares traded each day, heavy volume becomes the new norm. The surge marks a sharp step-up from a year ago. Equity turnover averaged a record $1.03 trillion in January, a roughly 50% increase from the same period in 2025, according to data compiled by Bloomberg Intelligence. More than 19 billion shares traded hands daily over the span, the second-most ever. This jump speaks to the aforementioned information services volatility but also the broad-based increase in participation across the market. Mom-and-pop investors and institutional players alike have become more active as US stocks hover near record highs.
Tech
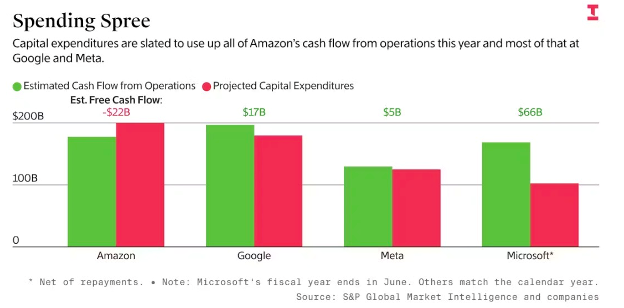
Hyperscalers reported strong growth last week, with Google Cloud growth accelerating to 48% y/y (up from 34% last quarter) and AWS growth accelerating to 24% y/y (up from 20% last quarter). However, this growth was overshadowed by an intense capex outlook, with MSFT projecting capex to grow from $83B in 2025 to $123B in 2026, META from $72B to $125B, AMZN from $125B to $155B, and GOOGL from $92B last year to a whopping $185B in 2026. Even more impressively, all of these companies will spend anywhere from 3-6x on capex this year compared with 2023, and these spending projections are set to amount to ~2.1% of US GDP in 2026, the largest infrastructure project in US history and just barely behind the Louisiana Purchase at ~3% (according to the WSJ).
It continues to be unclear if the capex spending will eventually subside as chipmakers continue to innovate.
- What seems to make the ROI make sense is the ability to allow companies to operate more efficiently.
- The seat-based model, a subscription structure where customers pay a recurring fee for each individual user ("seat") with access to software, shows signs of disruption as work is beginning to be allocated to AI agents. SaaS companies’ adaptation looks to be based on whether they can provide AI agents with tools to operate.
Historically, selloffs around spending plans have been good times to step into these names as long as growth is there. That certainly describes the current environment, but it remains to be seen whether this spending wall might just be too high.
Software
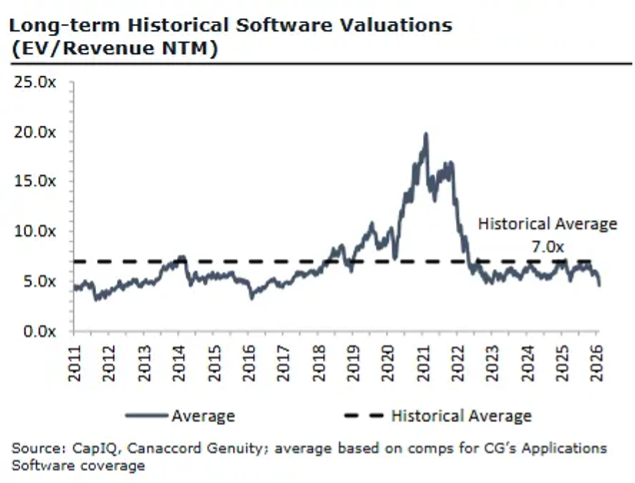
Multiples for software stocks are near 10-year lows at ~4.6x NTM EV/Rev, solidly below the ~7x long-term avg. Concerns span multiple fronts, including fears around AI-driven headwinds to seat-based SaaS business models and the rise of “vibe coding,” which could reduce the need for third-party SaaS vendors altogether.
Since 1990, there have been 11 drawdowns in the S&P500 Software sector >20%, and at -29.9%, this is the 5th worst one on record and based on historical data things could get much worse.
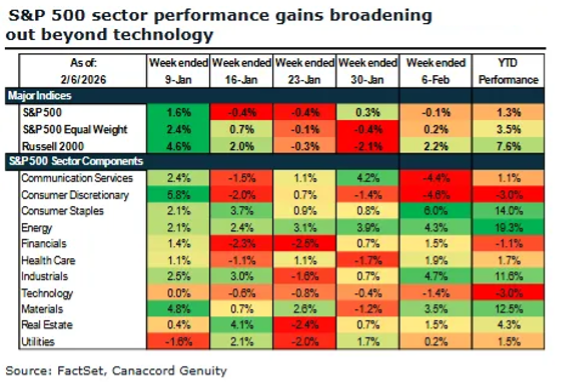
The crack in large tech has created a tailwind for cyclical and small-caps:
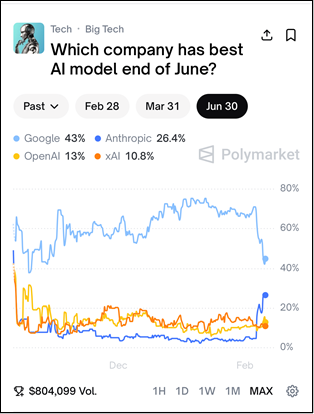
Is the AI race about to take a turn?
As of mid-February 2026, Google currently leads the Polymarket prediction for having the "best AI model" by June 30, holding a 43% probability. Google’s odds recently experienced a sharp decline from previous highs above 70%, but it is not Open AI. Anthropic has seen a substantial surge to 26.4%. Market participants are also pricing in smaller chances for OpenAI (13%) and xAI (10.8%), with total trading volume for this specific prediction exceeding $800,000.
Private Investments
Private Equity
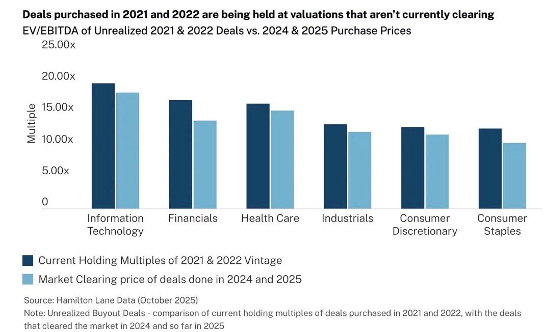
Data from Hamilton Lane shows private equity deals made prior to interest rate hikes continue to have valuation marks above where deals are being done.
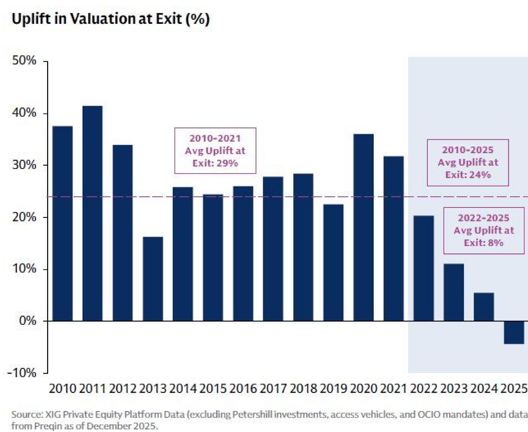
Data from Prequin confirms that deals are exited at a discount to their marked NAV.
Real Estate
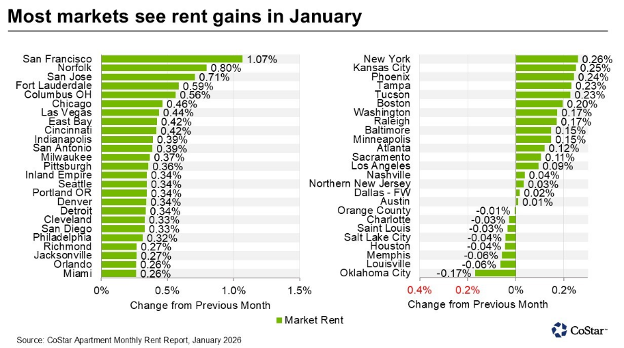
According to Costar data, the average monthly apartment rents in the U.S. edged higher in January, extending the modest rebound that began in December. The Midwest led with a 0.27% increase in average apartment rents, followed by the Northeast at 0.21%, the South at 0.17%, and the West at 0.09%. On an annual basis, the Midwest continued to outperform, with average rent growth of 2.1%, followed by the Northeast at 1.4%. Year over Year. Rents in the South declined 0.2%, while rents in the West fell by an average of 1.5%.
Economic Calendar: Week Ahead (Eastern Time)
Tues, 2/17 @ 830 am: Empire State Manufacturing Survey
Wed, 2/18 @ 830 am: Housing Starts (Delayed Report)
@ 830 am: Building Permits
@ 830 am: Durable-goods orders (Delayed Report)
@ 200 pm: Minutes of Fed’s January FOMC meeting
Thu, 2/19 @ 830 am: Initial Jobless Claims
@ 830 am: U.S. Trade Deficit
@ 830 am: Philadelphia Fed Manufacturing Survey
@ 10 am: Pending Home Sales
Fri, 2/20 @ 830 am: GDP
@ 830 am: Personal Income/Spending
@ 830 am: PCE (Personal Consumption Expenditure) Index
@ 10 am: New Home Sales (Delayed Report)