
6 minute read
Smart insight and clear visuals that matter – what we’re watching now and how intention and conviction shape our portfolios.
Markets
We have described what’s been going on in the market in our own way, “deflation in digital, inflation in physical.” This morning the market is down on the inflationary side. Specifically, it was the wholesale inflation report which showed costs rising at 2.9%, much higher than the 1.6% economists expected. Earlier in the week, UBS phrased it well. Their head of wealth said that the market is undergoing a change from “bits to atoms."
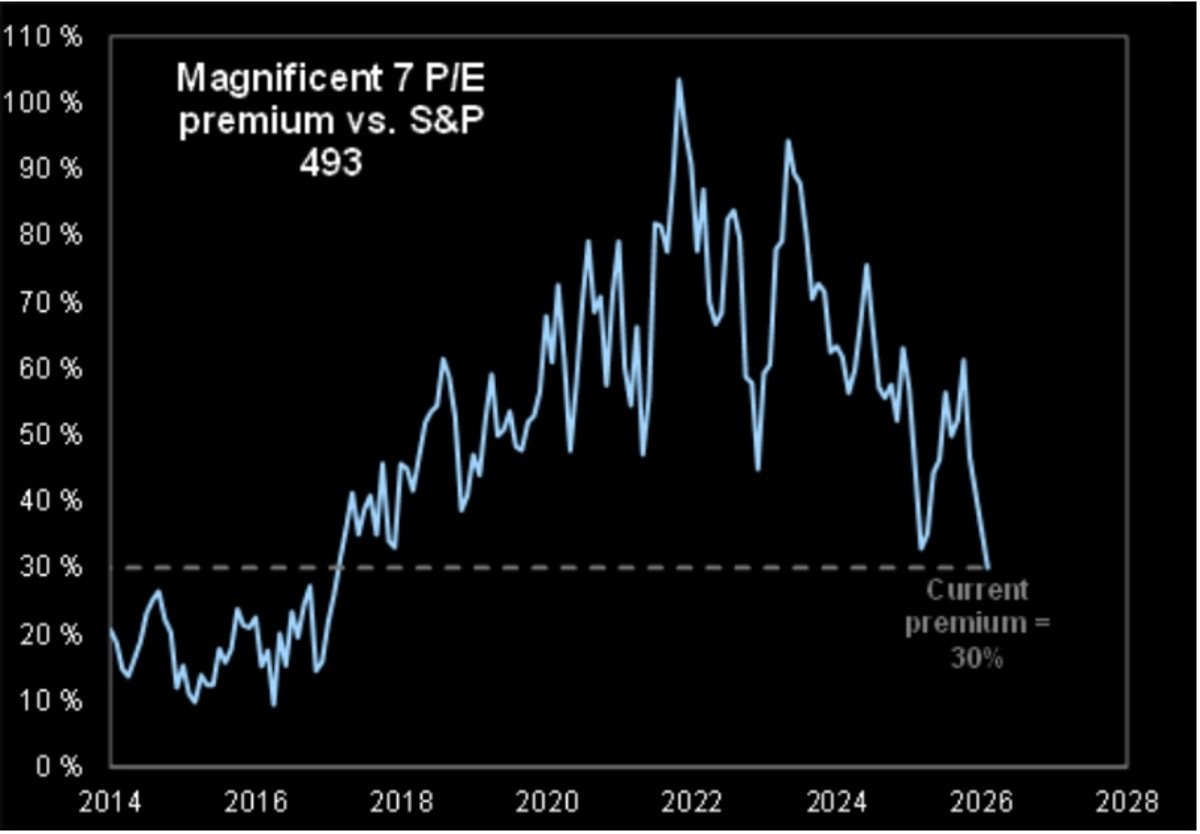
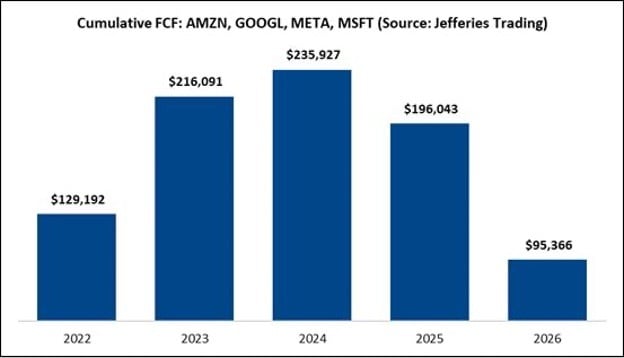
Another way to show this, see below, the MAG-7 are trading at the lowest premium vs. S&P 493 in the last 10 years per the first graph. The reason of course is that now MSFT, META, AMZN, and GOOGL are anticipated to see a ~50% drop in cumulative FCF, and a 62% decline when factoring ORCL into the mix (see second chart below). Spending can continue but the next step is borrowing the money or becoming FAR more efficient.
Source: Factset
From Bits to Atoms
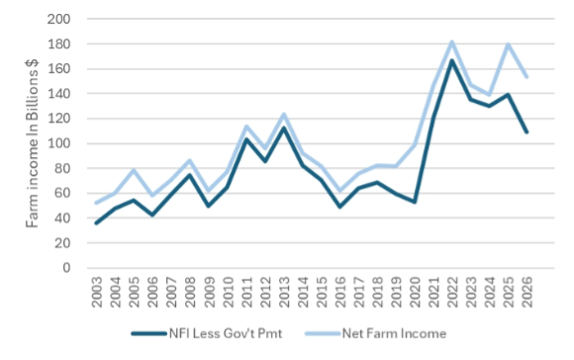
So where have we been adding money ... to commodities, one-third into what are called soft commodities. A brief reminder of the backdrop there, Farmer Economics have yet to turn. Historically, the ag cycle is ~5-7yrs, with 2-3yrs of a downturn followed by 3-5yrs to the next peak. Post COVID, the ramp to peak was closer to 2.5yrs with farmer income levels peaking in 2022. Current farmer health remains weak with the USDA projecting farm income levels to decline ~15% in 2026. Increased input costs, trade volatility, and elevated debt/asset ratios are headwinds to significant equipment purchases and suggest a more gradual recovery which may mean good things for the feedstocks themselves.
Sector Performance
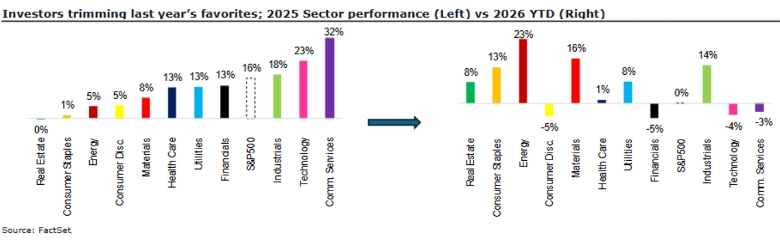
Equity market performance has become increasingly bifurcated, with many of last year’s strongest sectors now acting as notable drags on index returns. S&P500 Tech stocks, which advanced 23% in 2025, are currently down 4% YTD, pressured by concerns surrounding AI disruption, sustainability of demand (particularly software) and elevated Cap-Ex commitments. A similar reversal is evident within communication services (home to many semiconductor stocks), where the group is down 3% YTD following a robust 32% gain last year.
Asset Allocation
There is reason to believe the new beneficiaries could be international stocks, emerging markets, and small/mid cap stocks:
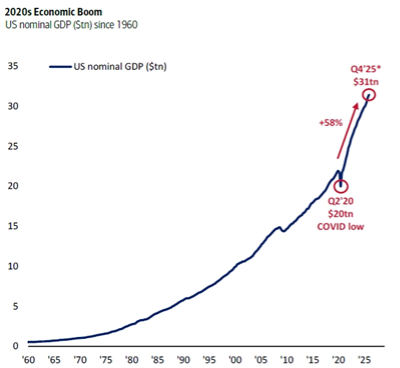
In the past 5 years US nominal GDP has risen an extraordinary 58%, supercharged by the Fed, a 55% jump in US government spending ($4.5tn to $7tn), and a 64% surge in the national debt ($15tn to $39tn). The nominal economic boom and its associated causes and consequences inequality, populism, isolationism, inflation, debt) has resulted in a great bond bear market (peak-to-trough price of 30-year US Treasury has collapsed 54%). Asset allocation out of bonds in the 2020s (the ABB “Anything But Bonds” trade) has sparked huge bull markets in financial assets such as US tech stocks, European & Japanese banks, crypto, and gold. The US fiscal excess of H1’2020s is now being replicated in the rest of the world, with governments increasing defense spending, energy infrastructure, and welfare spending to address inequality. This is why the Anything But Bonds trade (allocation from bonds to stocks) is now happening in Europe, Japan, and next China.
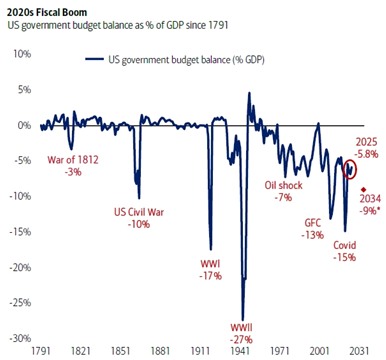
Source: BofA Global Investment Strategy, GFD Finaeon, Moody’s Deficit estimate for 2034 based on Moody’s rationale for US sovereign rating downgrade on 15 May ’25
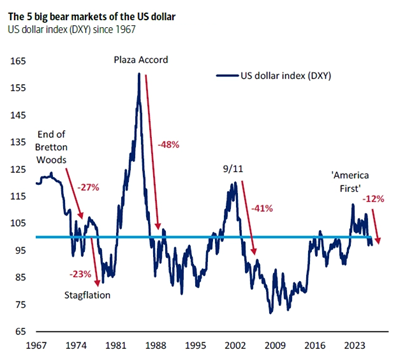
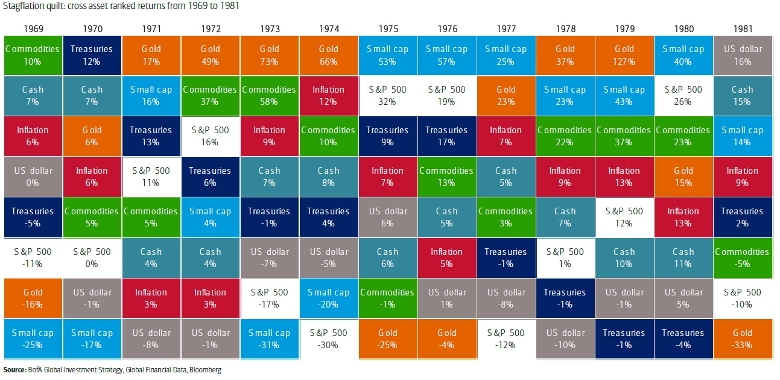
Geopolitical realignment (end of Vietnam War, Nixon visits USSR & China, UK accession to EC), trade war (Nixon tariffs on Japan), pro-cyclical fiscal & monetary policies, US dollar debasement (end of Bretton Woods), Fed policy mistakes and political subservience (Nixon & Burns), commodity price shocks, state nationalization of strategic industries/assets, inflationary boom to inflation hiatus via government price controls to stagflation bust, end of tech Nifty 50 secular bull … 1970s as good a historical analog as any other decade for 2020s. The US Debt-to-GDP was approximately 35%, then versus the 120% today, significantly limiting the Federal Reserve’s ability to use (20% interest rates) to kill inflation, but the relative rankings are relevant.
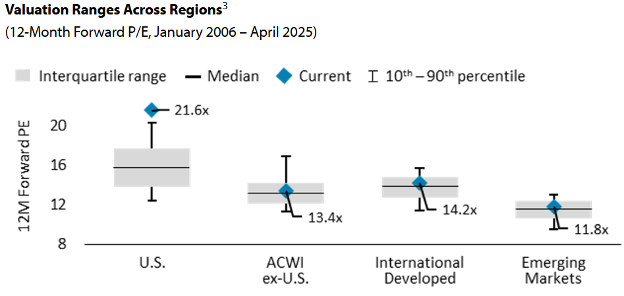
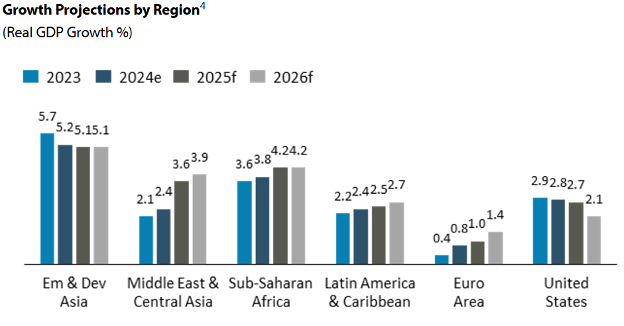
International
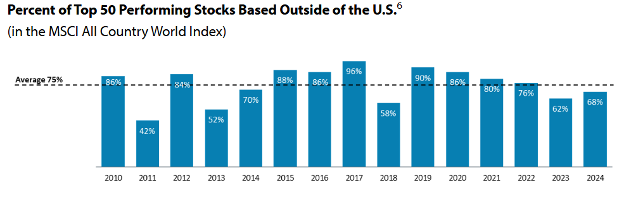
In addition to historically high valuations for U.S. equities, projected elevated growth rates in non-U.S. countries provide a case for potential opportunities of return enhancement and diversification. Approximately 96% of the world’s population, 84% of the world’s economic activity, and 65% of public companies with market capitalizations greater than $5 billion are located outside the United States. Data indicates many countries offer superior growth opportunities relative to the U.S. On average over the last 14 years, 75% of the 50 top performing stocks in the MSCI ACWI Index were non-U.S. stocks.
Source: Baird Asset Management
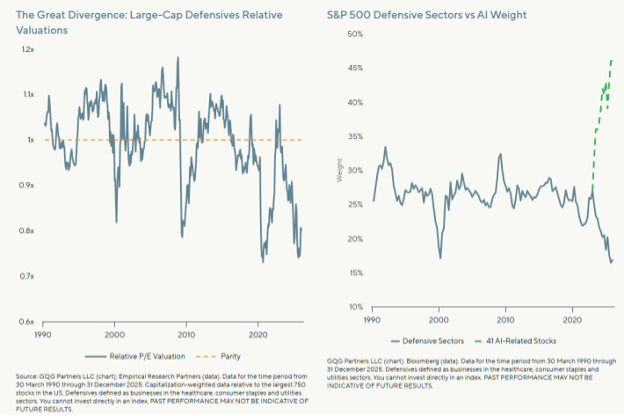
Defensive Stocks
Charts from GQG Partners, below, show defensive stocks (i.e. consumer staples, regulated utilities) had been trading near multi-decade lows. The best thing about defensive stocks is that you know exactly what you are going to get. The data center exposure faces many uncertainties including potentially aggressive accounting, lots of debt added to the system, China building out capacity, cash flow to fund comes from ad revenue which could have a cycle. Within the S&P 500, the AI related exposure has jumped nearly 50% while defensive represents ~17%.
Wealth
- The worldwide wealth transfer is the equivalent of three years of global fixed capital investment spending.
- Nearly 40 years ago, total U.S. family wealth adjusted for inflation stood at approximately $38 trillion. Today, it is closer to a staggering $140 trillion.
- A Betterment survey found that 64% of Gen Z and 49% of Millennials are willing to take on more investment risk. How do I take the other side of this?
- Remember what Warren Buffett taught us, “The less the prudence with which others conduct their affairs, the greater the prudence with which we must conduct our own."
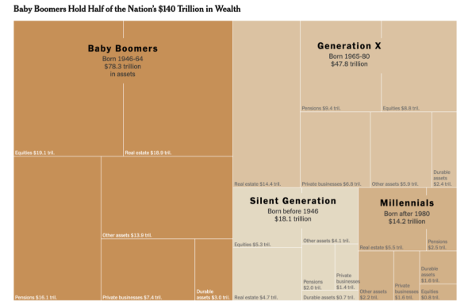
Source: Wealth by Generation - NYT
Economic Calendar: Week Ahead (Eastern Time)
Mon, 3/2 @ 10 am: ISM Manufacturing
Wed, 3/4 @ 815 am: ADP Employment
@ 10 am: ISM Services
@ 200 pm: Fed Beige Book
Thu, 3/5 @ 830 am: Initial Jobless Claims
@ 830 am: Import Price Index
Fri, 3/6 @ 830 am: U.S. Employment Report
@ 830 am: U.S. Unemployment Rate
@ 830 am: U.S. Hourly Wages/ Hourly Wages YoY